 2
2peptides
spectra
0.000 | 0.000
0.000 | 0.105
0.000 | 0.092
0.000 | 0.106
0.000 | 0.111
0.000 | 0.099
0.777 | 0.856
0.000 | 0.000
3peptides
spectra

0.000 | 0.000
1.000 | 1.000
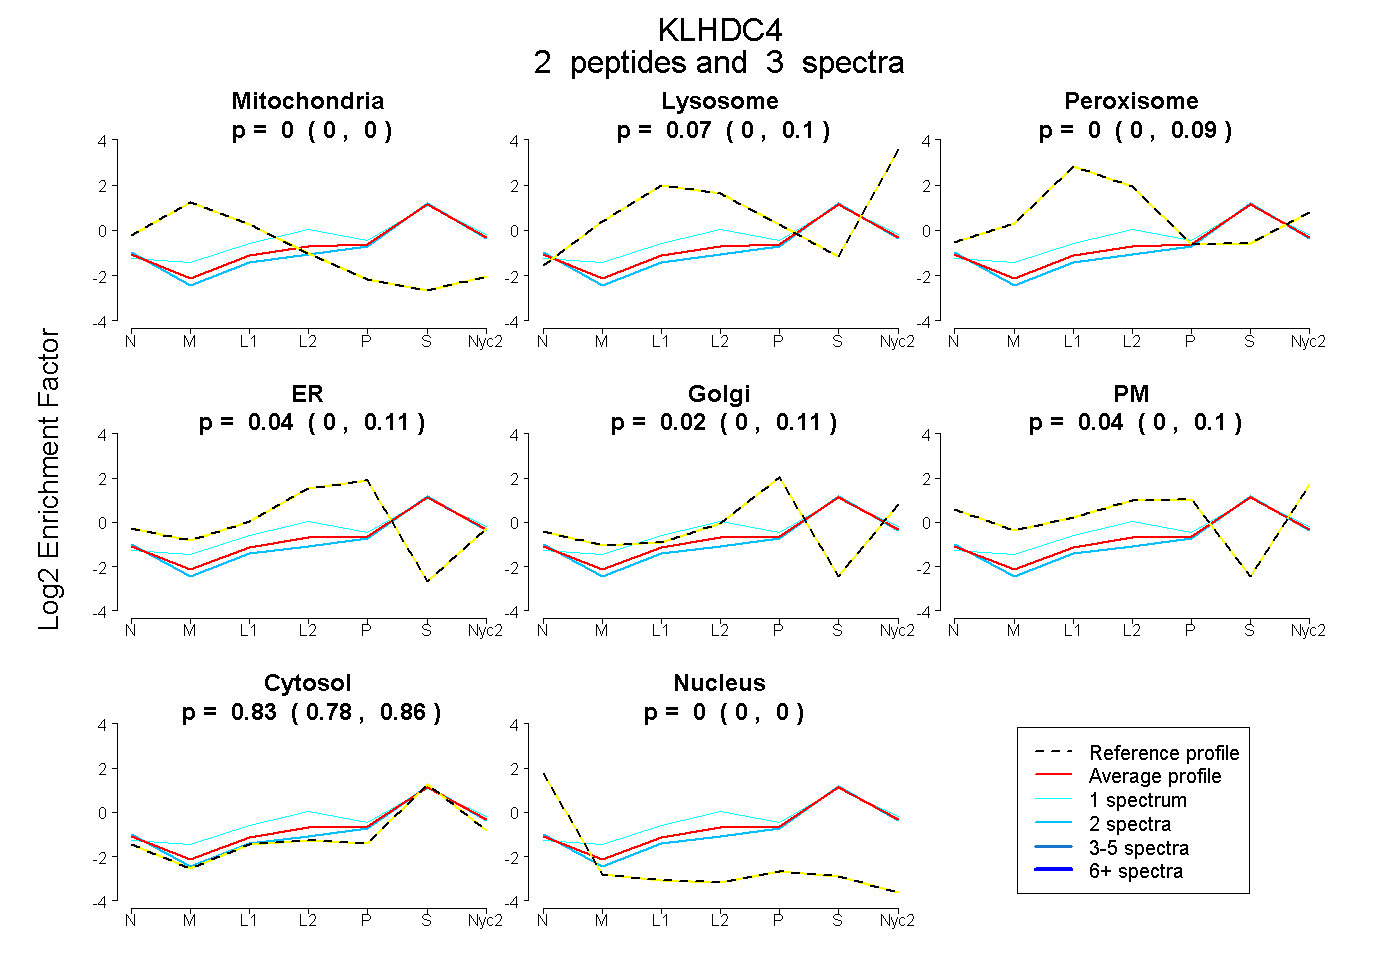
| Plot | Mito | Lyso | Perox | ER | Golgi | PM | Cytosol | Nucleus | |||||
| Expt A |
2 peptides |
3 spectra |
|
0.000 0.000 | 0.000 |
0.069 0.000 | 0.105 |
0.000 0.000 | 0.092 |
0.039 0.000 | 0.106 |
0.020 0.000 | 0.111 |
0.043 0.000 | 0.099 |
0.829 0.777 | 0.856 |
0.000 0.000 | 0.000 |
||
| Plot | Lyso | Other | |||||||||||
| Expt C |
3 peptides |
5 spectra |
|
0.000 0.000 | 0.000 |
1.000 1.000 | 1.000 |