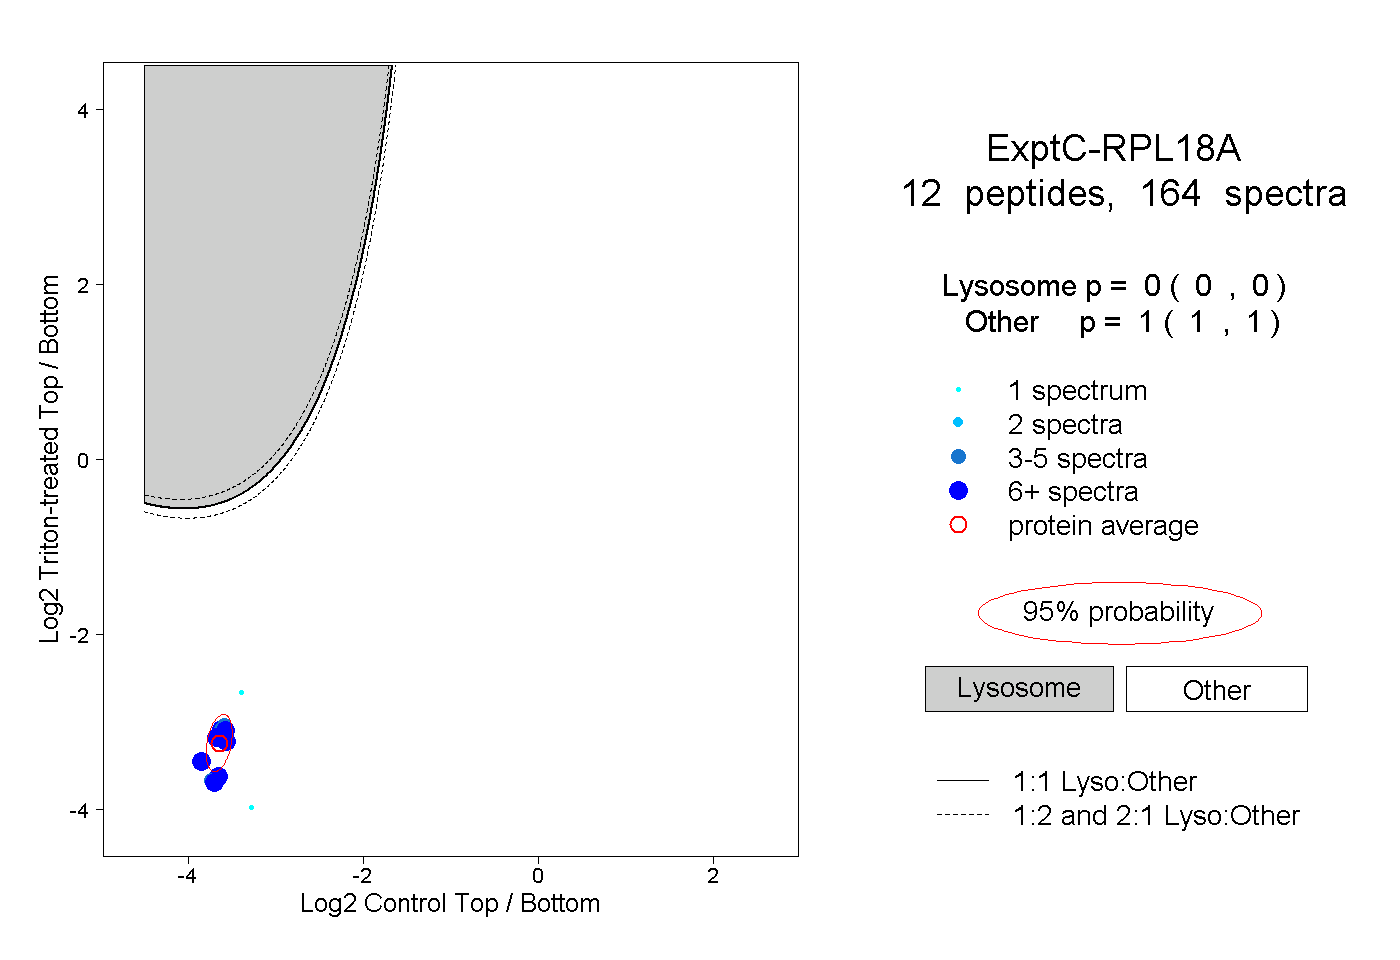
12
12peptides
spectra
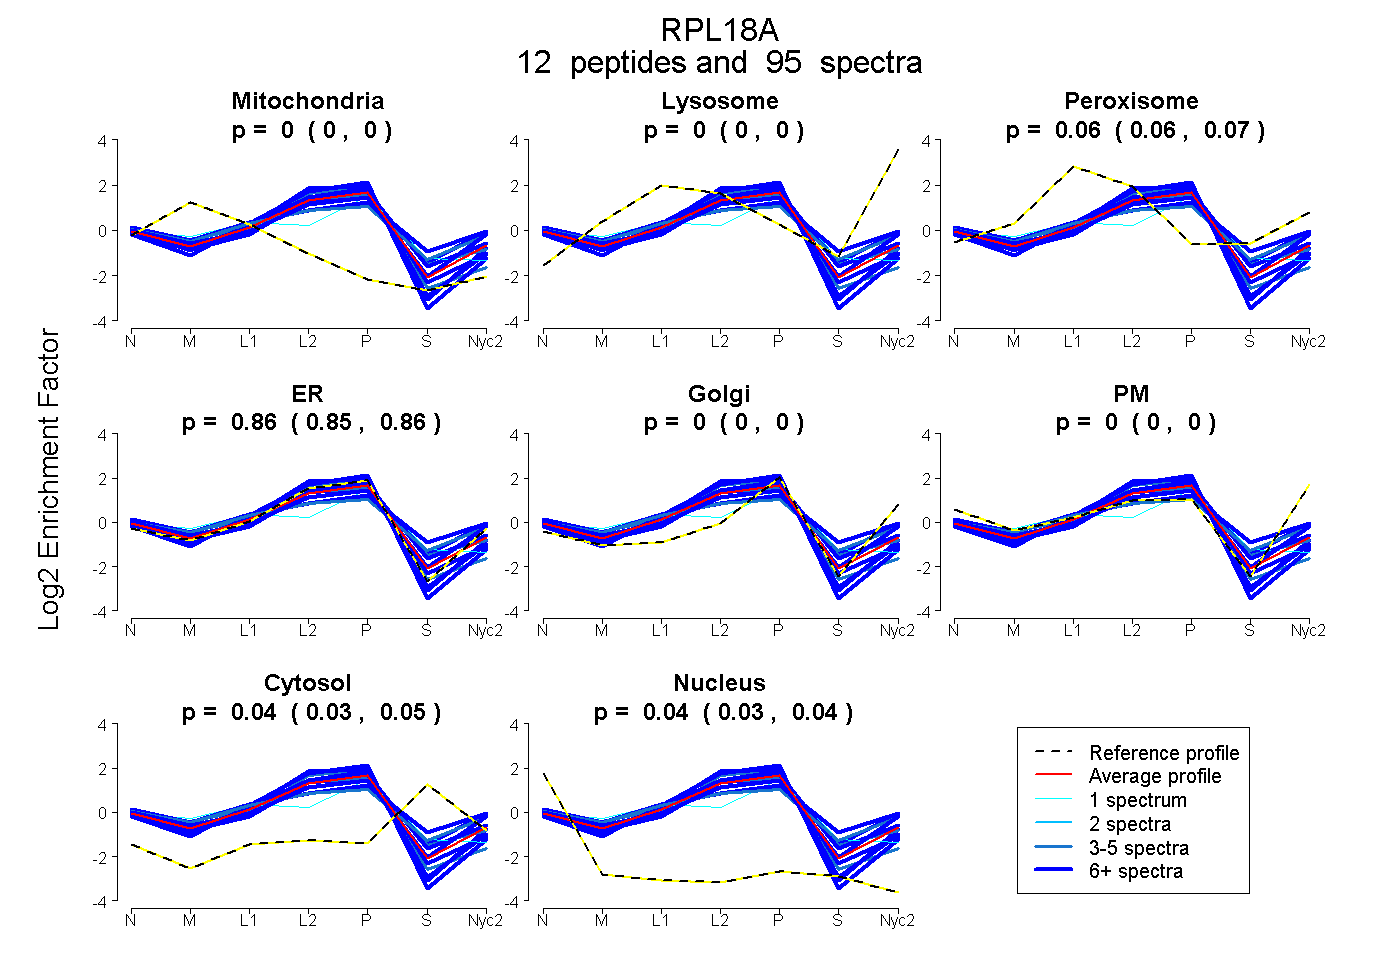
0.000 | 0.003
0.000 | 0.000
0.060 | 0.067
0.853 | 0.864
0.000 | 0.000
0.000 | 0.000
0.030 | 0.046
0.033 | 0.041
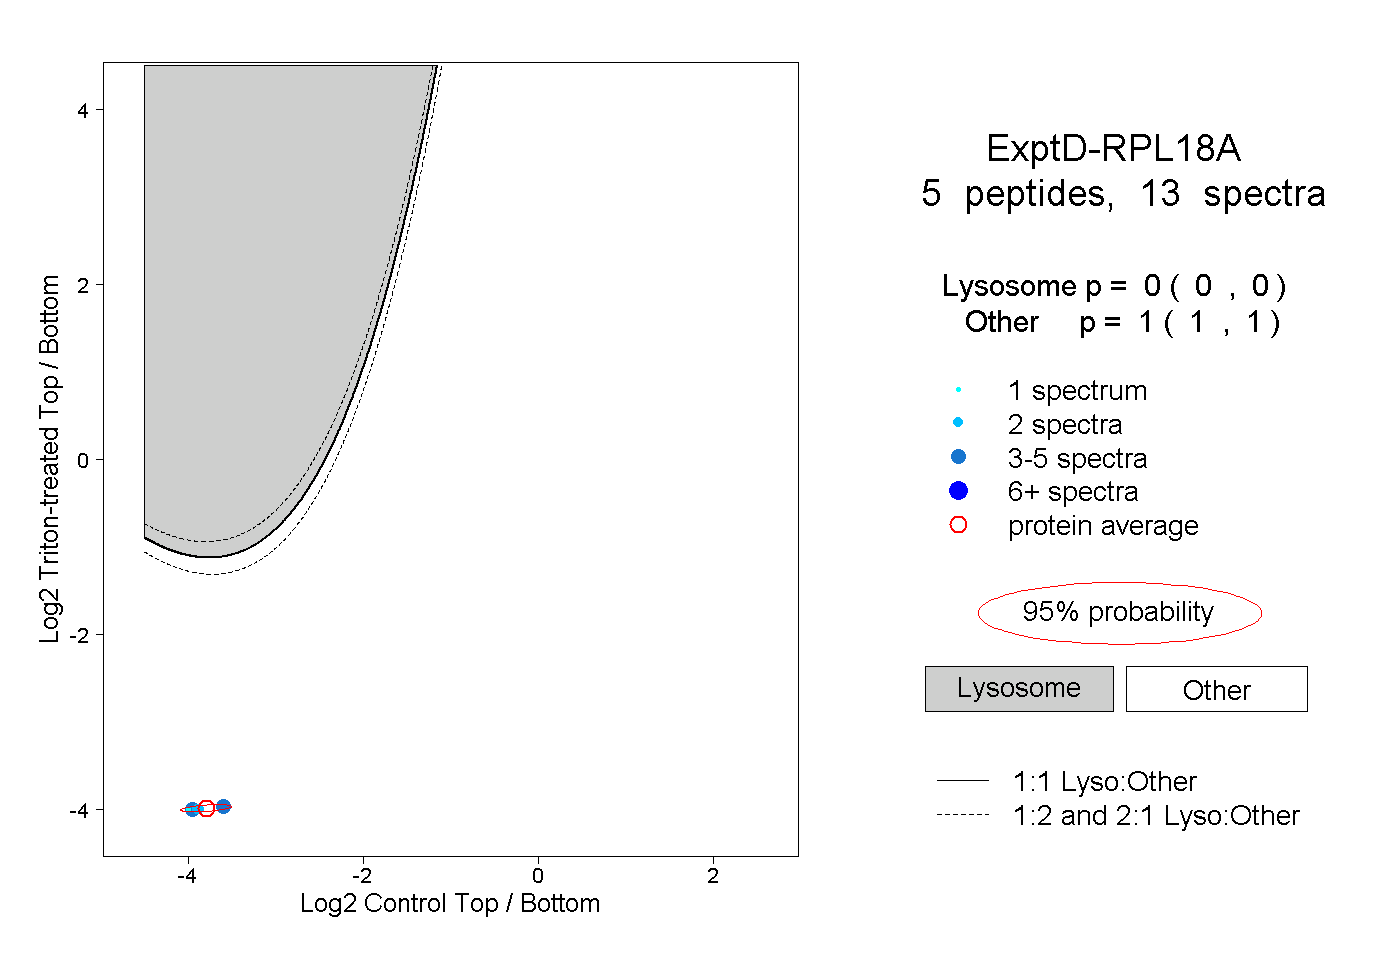
8peptides
spectra
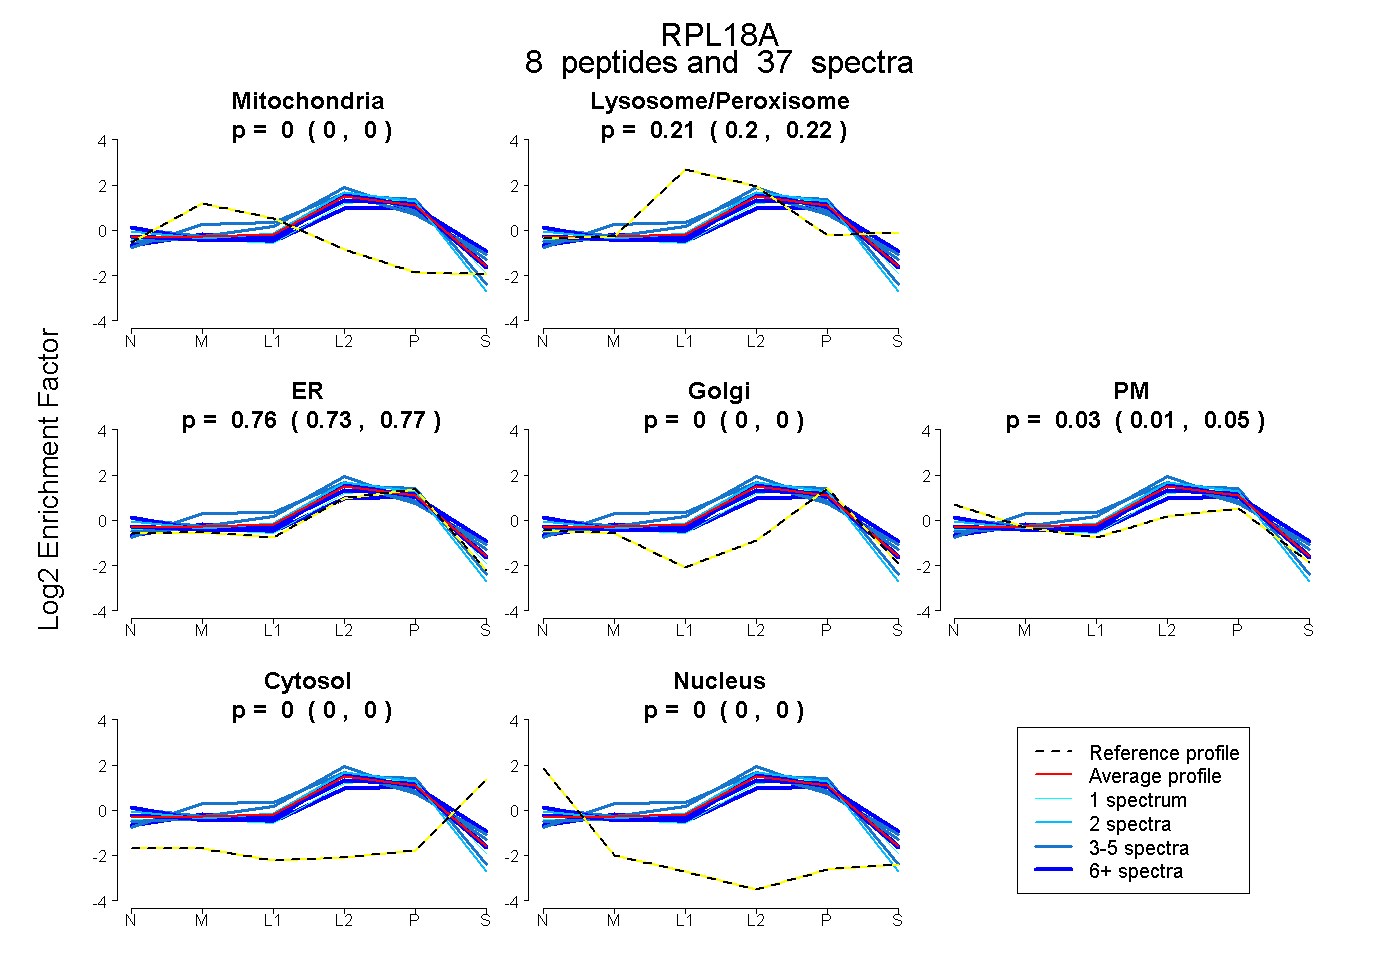
0.000 | 0.000
0.202 | 0.219
0.732 | 0.774
0.000 | 0.000
0.011 | 0.052
0.000 | 0.000
0.000 | 0.000