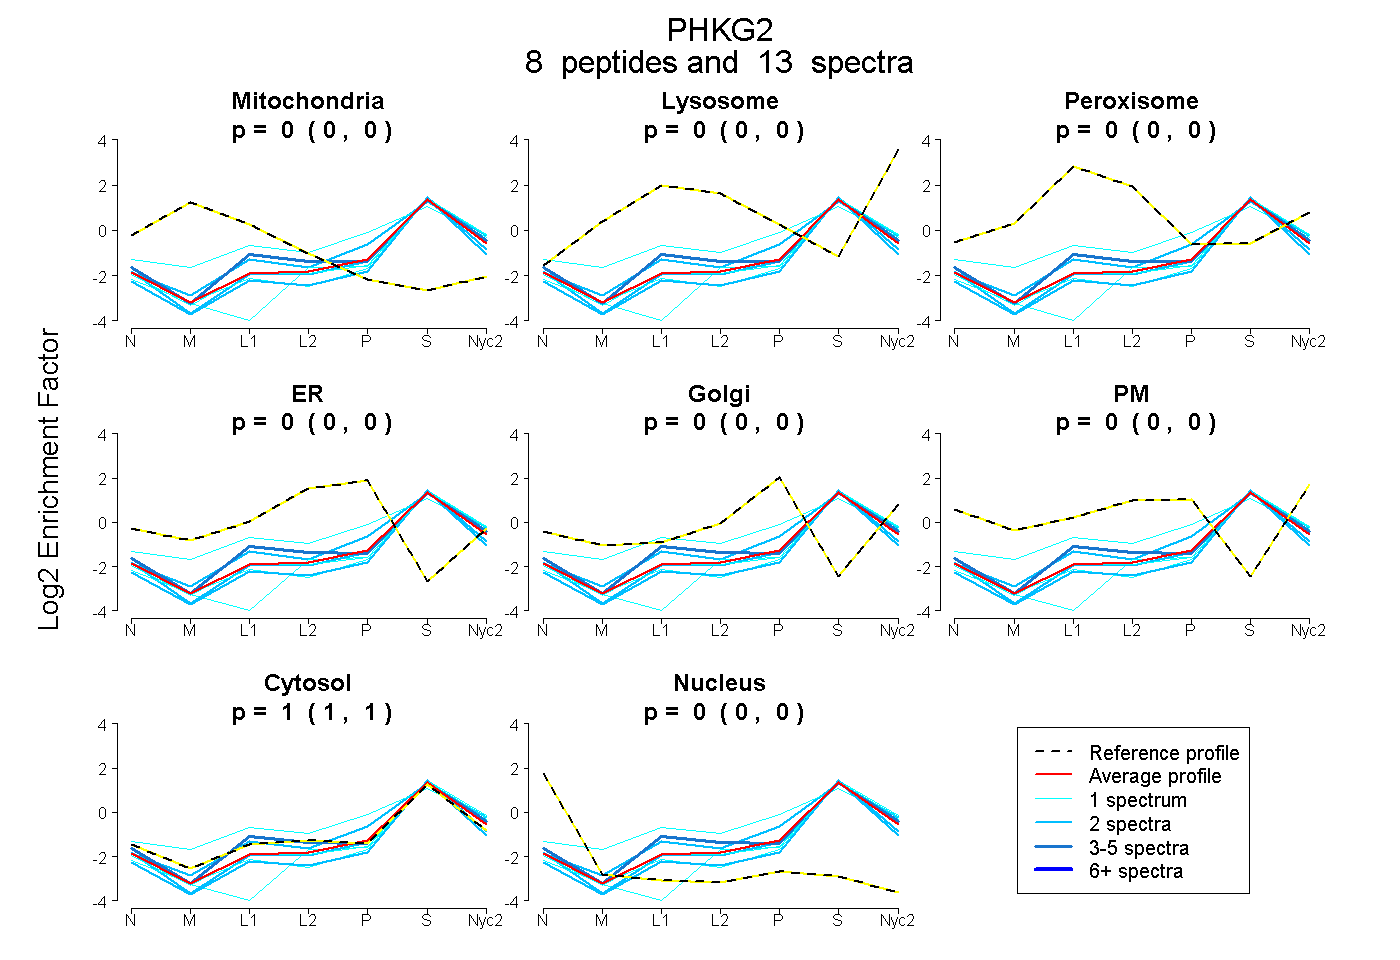
 8
8peptides
spectra
0.000 | 0.000
0.000 | 0.000
0.000 | 0.000
0.000 | 0.000
0.000 | 0.000
0.000 | 0.000
1.000 | 1.000
0.000 | 0.000
| Plot | Mito | Lyso | Perox | ER | Golgi | PM | Cytosol | Nucleus | |||||
| Expt A |
8 peptides |
13 spectra |
|
0.000 0.000 | 0.000 |
0.000 0.000 | 0.000 |
0.000 0.000 | 0.000 |
0.000 0.000 | 0.000 |
0.000 0.000 | 0.000 |
0.000 0.000 | 0.000 |
1.000 1.000 | 1.000 |
0.000 0.000 | 0.000 |
| 1 spectrum, VAVWTILAAGR | 0.000 | 0.000 | 0.000 | 0.000 | 0.000 | 0.000 | 1.000 | 0.000 | ||
| 1 spectrum, GELFDYLTEK | 0.000 | 0.063 | 0.064 | 0.000 | 0.143 | 0.000 | 0.729 | 0.000 | ||
| 3 spectra, GVSSVVR | 0.000 | 0.008 | 0.000 | 0.000 | 0.000 | 0.000 | 0.992 | 0.000 | ||
| 2 spectra, GSQPWNLTPR | 0.000 | 0.000 | 0.000 | 0.000 | 0.000 | 0.000 | 0.973 | 0.027 | ||
| 1 spectrum, LRPLTK | 0.000 | 0.000 | 0.000 | 0.000 | 0.000 | 0.000 | 1.000 | 0.000 | ||
| 2 spectra, ELCGTPGYLAPEILK | 0.000 | 0.007 | 0.000 | 0.000 | 0.057 | 0.000 | 0.936 | 0.000 | ||
| 2 spectra, LSLEQLEEVR | 0.000 | 0.000 | 0.000 | 0.000 | 0.000 | 0.000 | 0.980 | 0.020 | ||
| 1 spectrum, EMHILR | 0.000 | 0.000 | 0.000 | 0.000 | 0.000 | 0.000 | 0.903 | 0.097 |
| Plot | Mito | Lyso or Perox | ER | Golgi | PM | Cytosol | Nucleus | ||||||
| Expt B |
1 peptide |
1 spectrum |
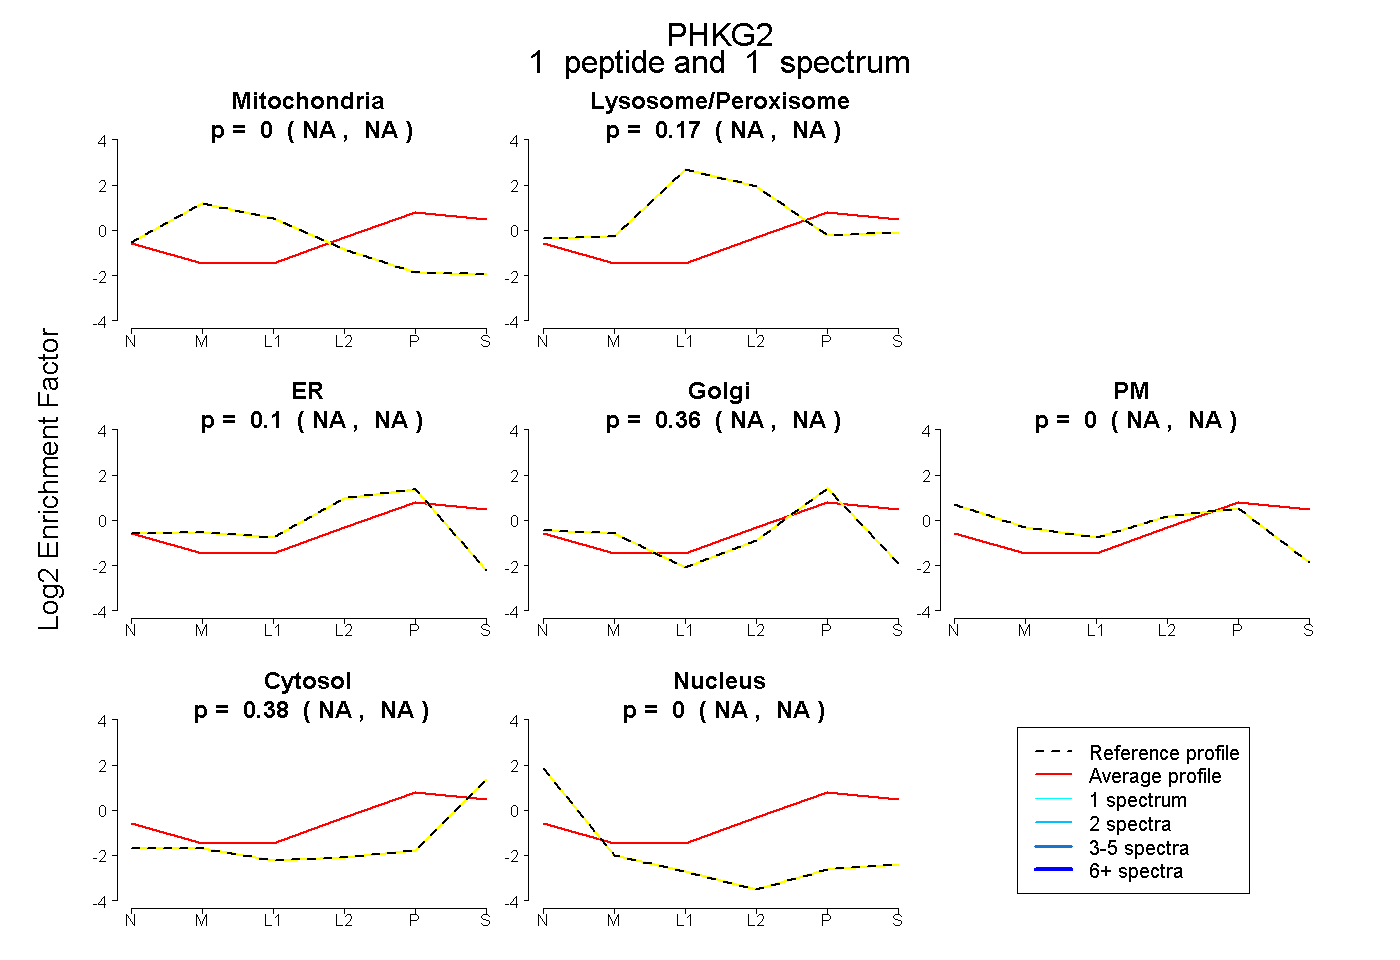 |
0.000 NA | NA |
0.166 NA | NA |
0.096 NA | NA |
0.363 NA | NA |
0.000 NA | NA |
0.375 NA | NA |
0.000 NA | NA |
|||
| Plot | Lyso | Other | |||||||||||
| Expt C |
3 peptides |
7 spectra |
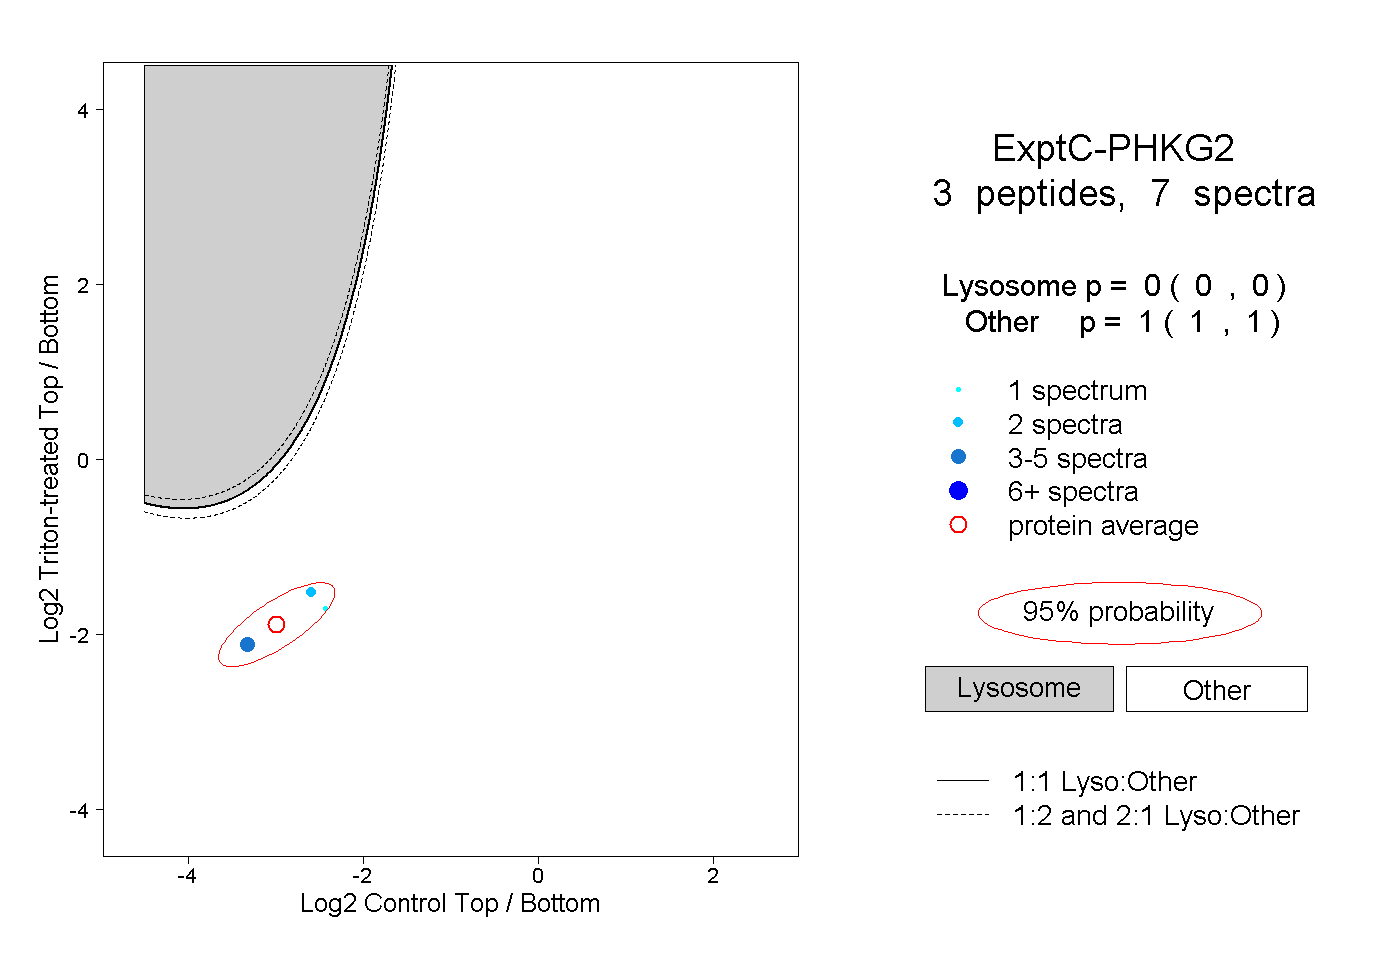 |
0.000 0.000 | 0.000 |
1.000 1.000 | 1.000 |