 18
18peptides
spectra
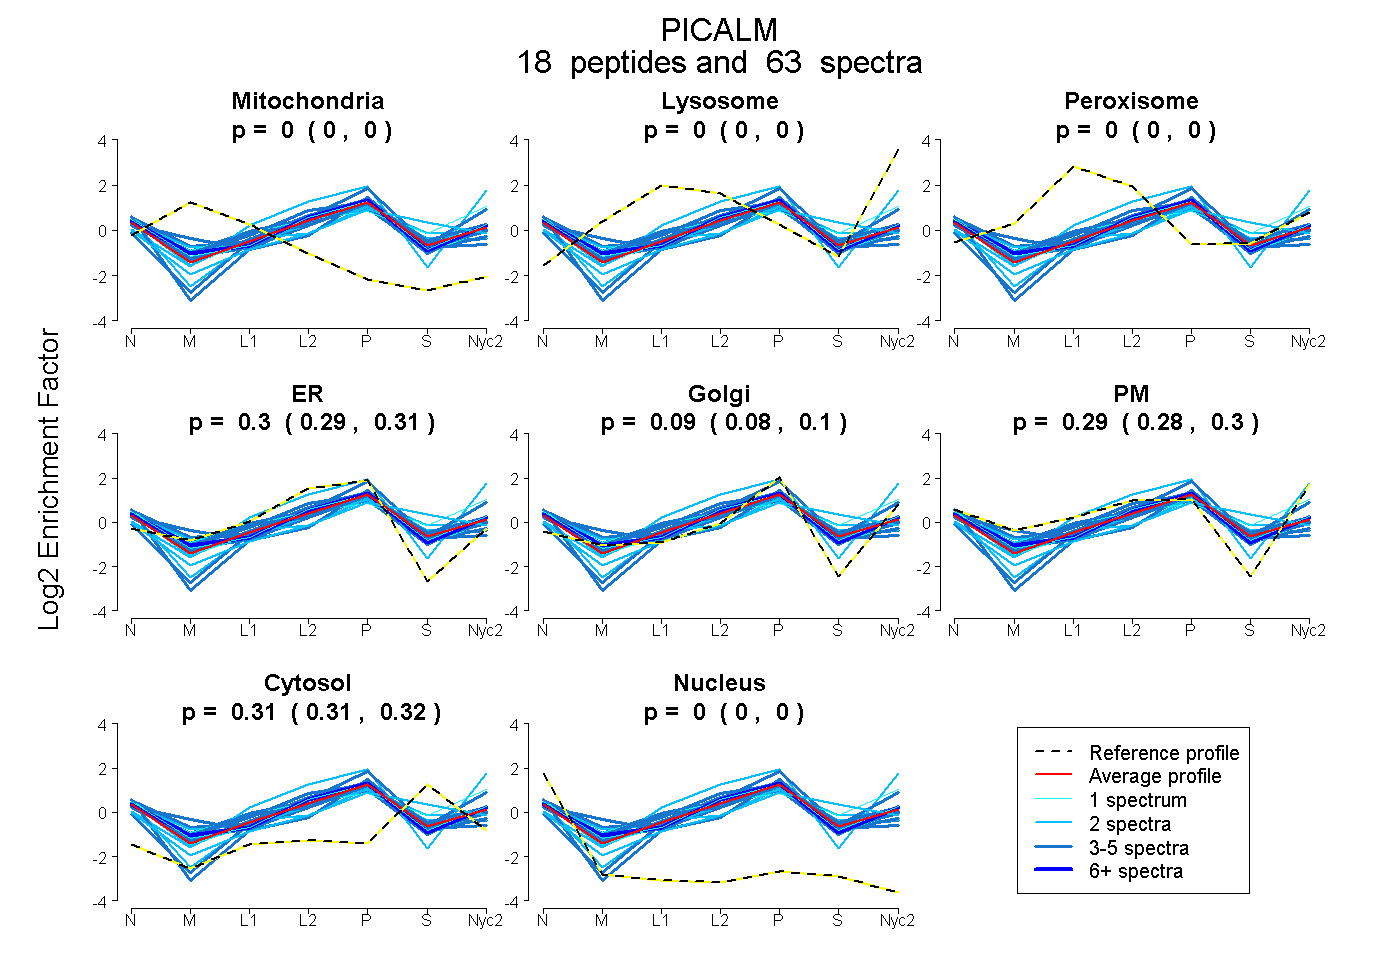
0.000 | 0.000
0.000 | 0.000
0.000 | 0.000
0.286 | 0.312
0.084 | 0.105
0.277 | 0.299
0.311 | 0.318
0.000 | 0.000
7peptides
spectra
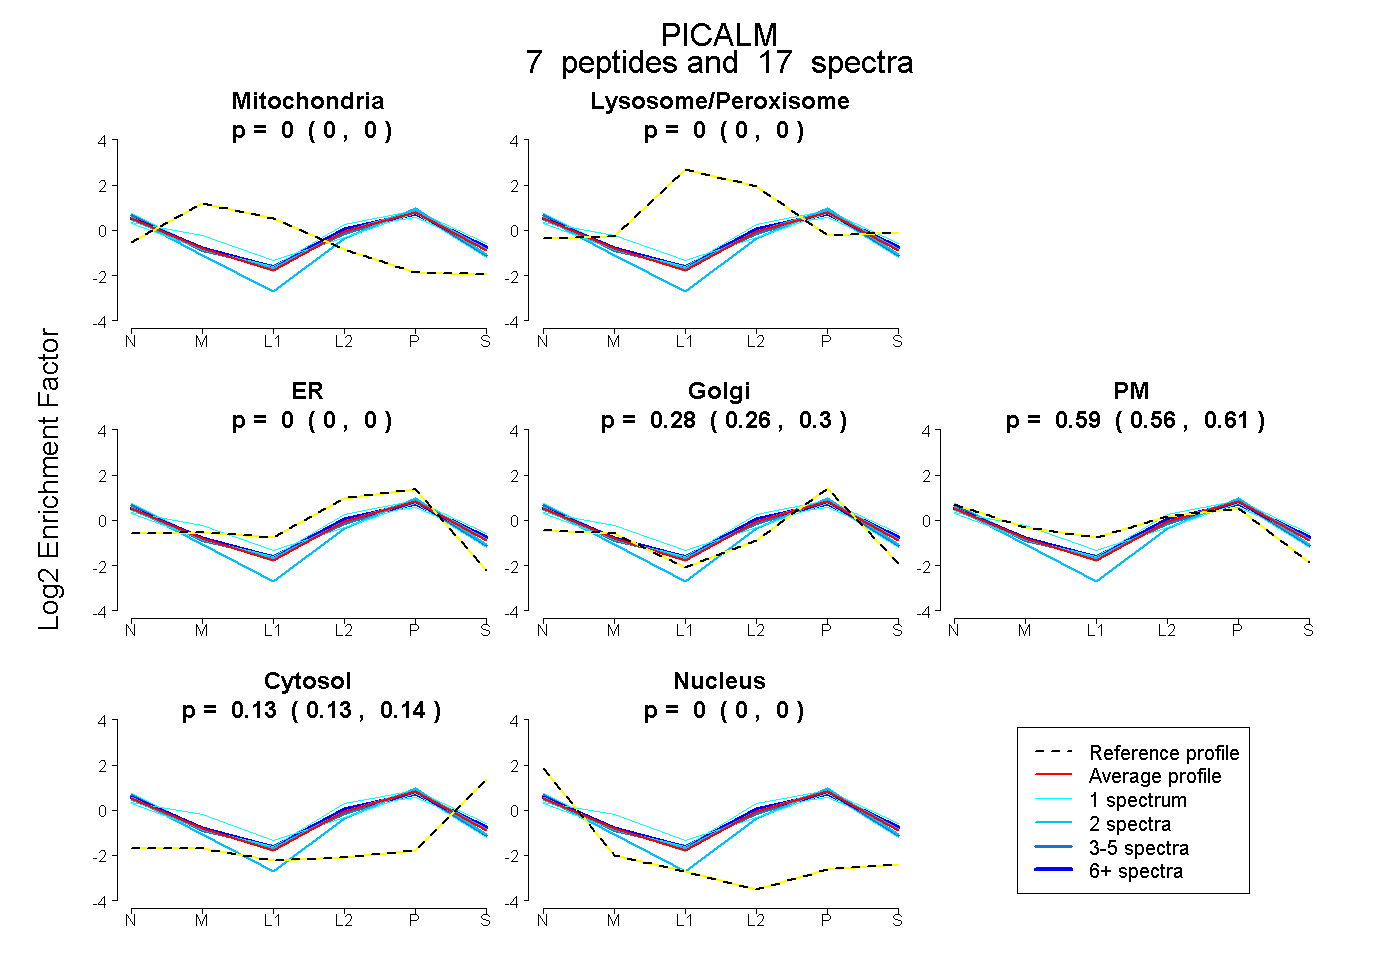
0.000 | 0.000
0.000 | 0.000
0.000 | 0.000
0.256 | 0.300
0.562 | 0.608
0.126 | 0.138
0.000 | 0.000
9peptides
spectra
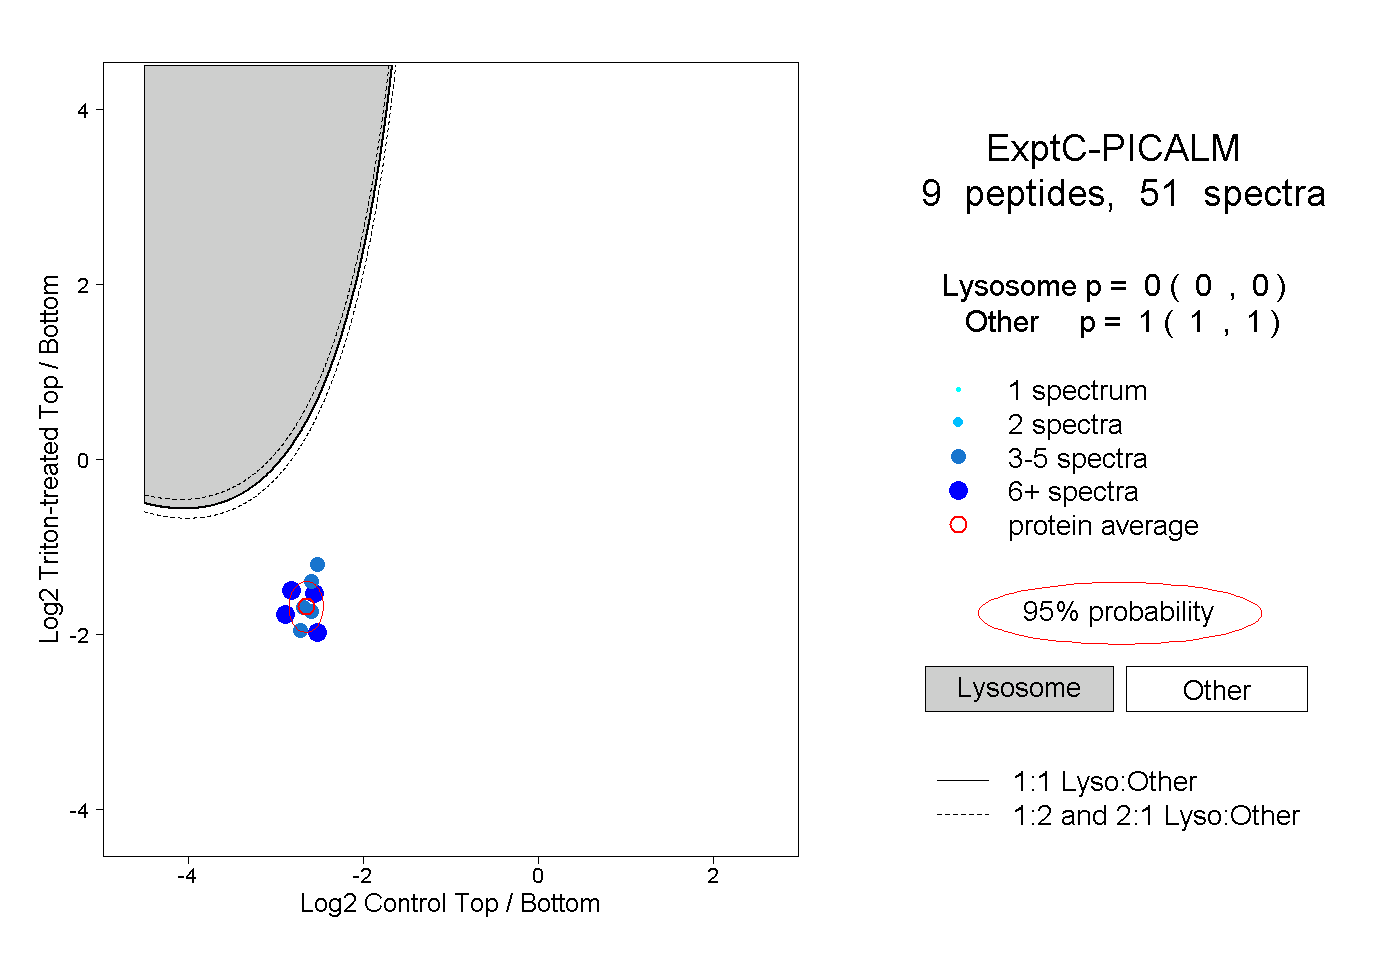
0.000 | 0.000
1.000 | 1.000
5peptides
spectra
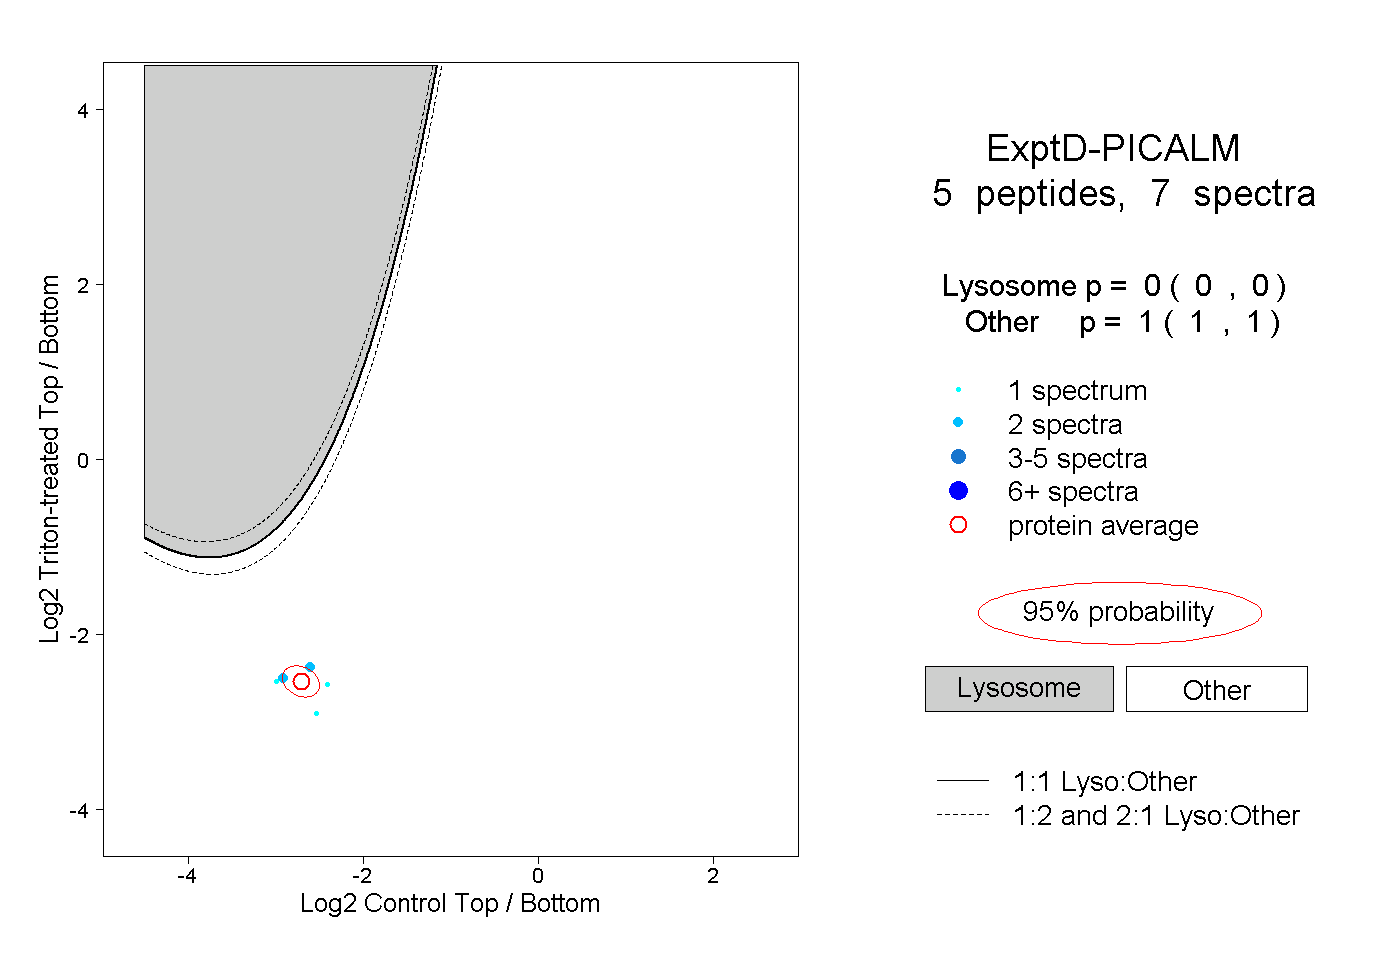
0.000 | 0.000
1.000 | 1.000