 30
30peptides
spectra
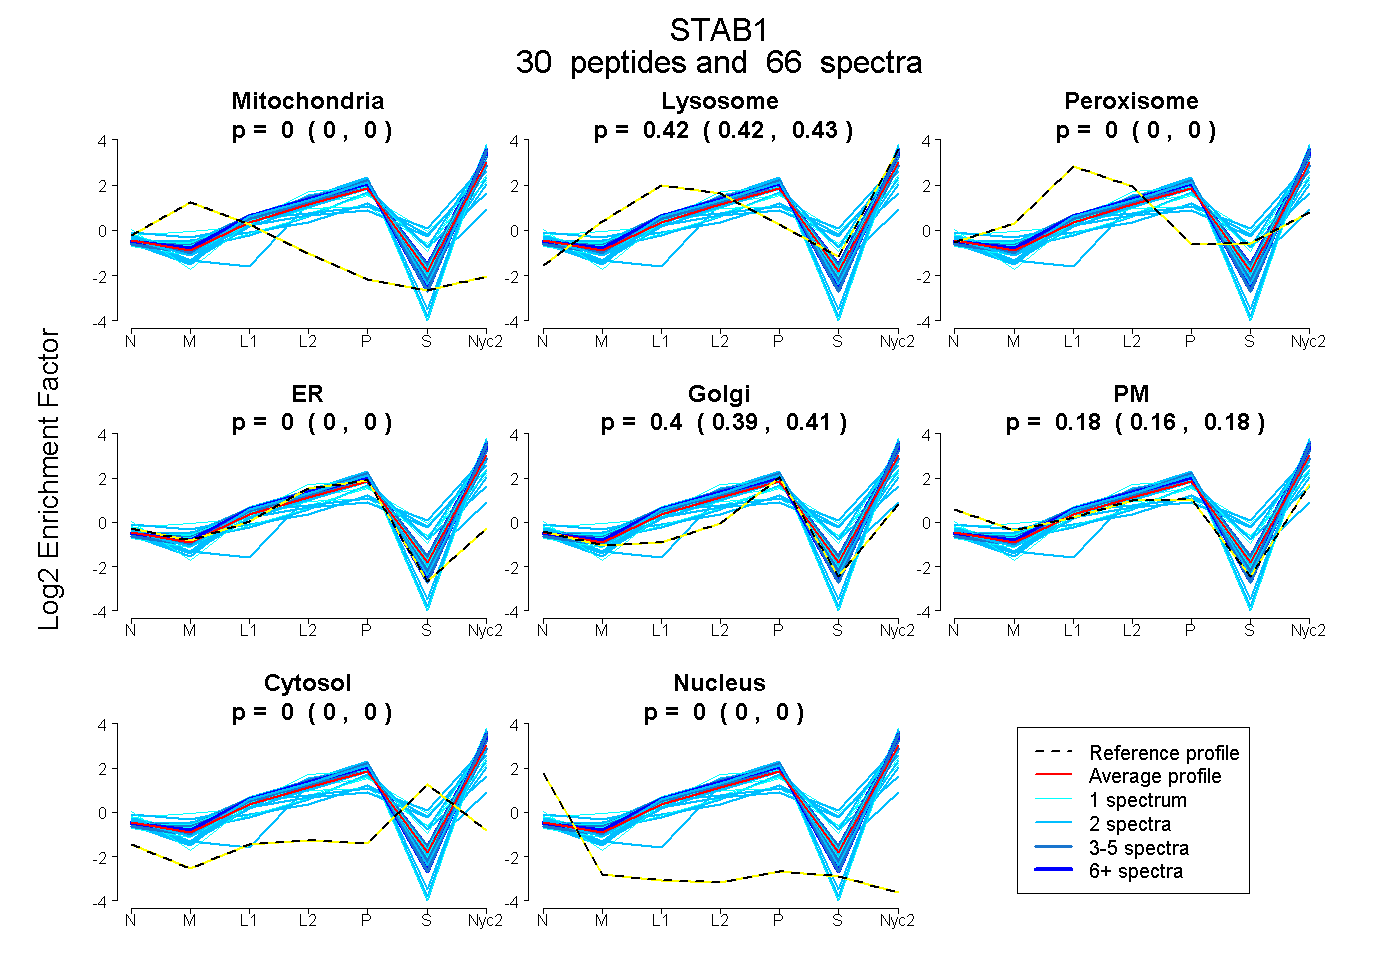
0.000 | 0.000
0.417 | 0.429
0.000 | 0.000
0.000 | 0.000
0.395 | 0.407
0.165 | 0.183
0.000 | 0.000
0.000 | 0.000
3peptides
spectra
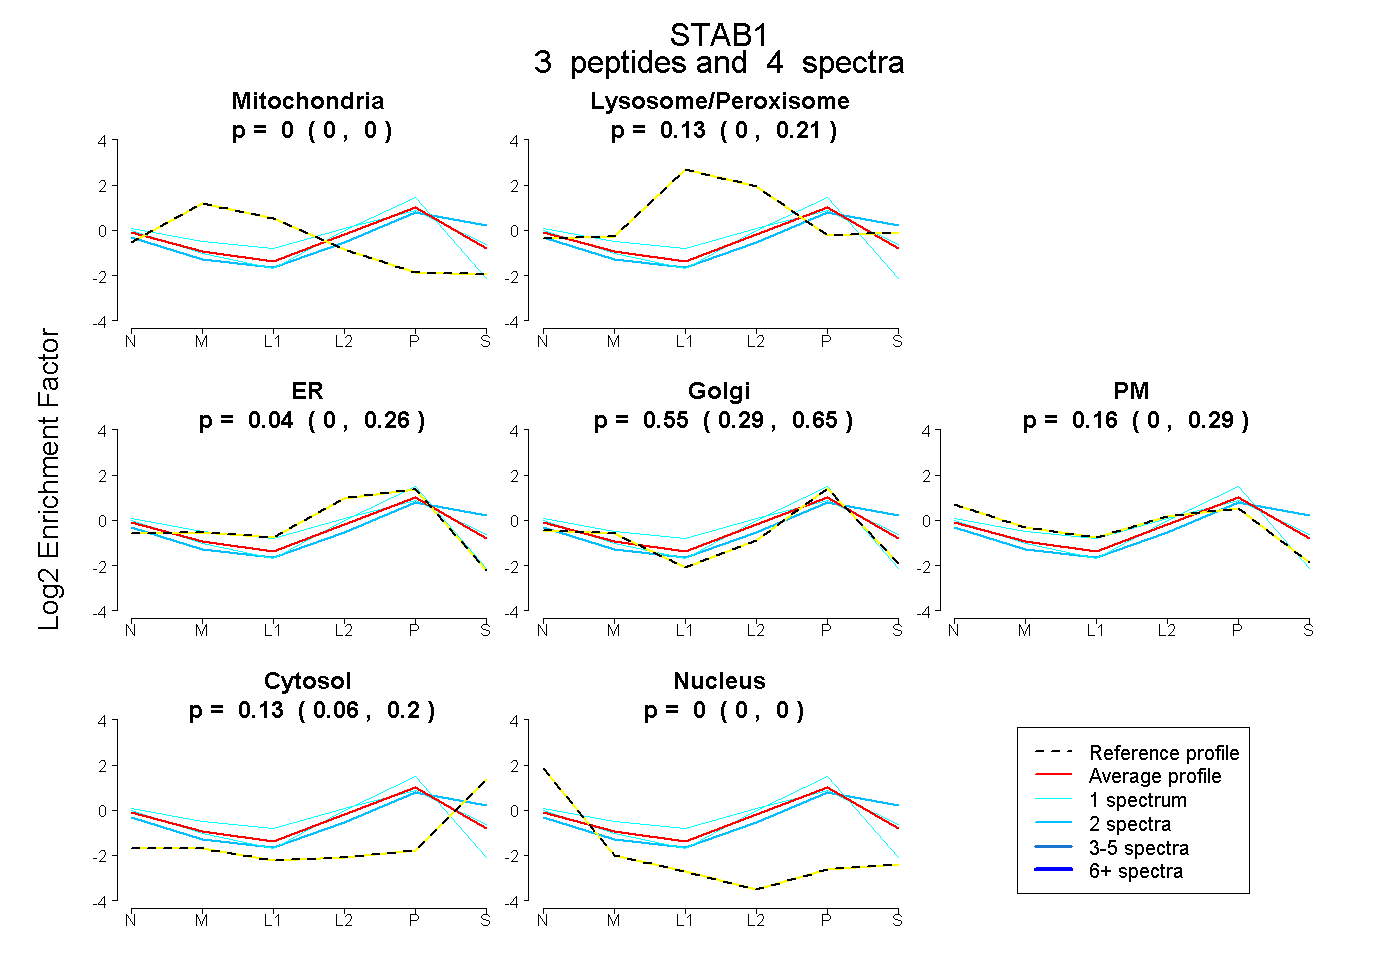
0.000 | 0.000
0.000 | 0.205
0.000 | 0.264
0.287 | 0.651
0.000 | 0.294
0.058 | 0.199
0.000 | 0.000
20peptides
spectra
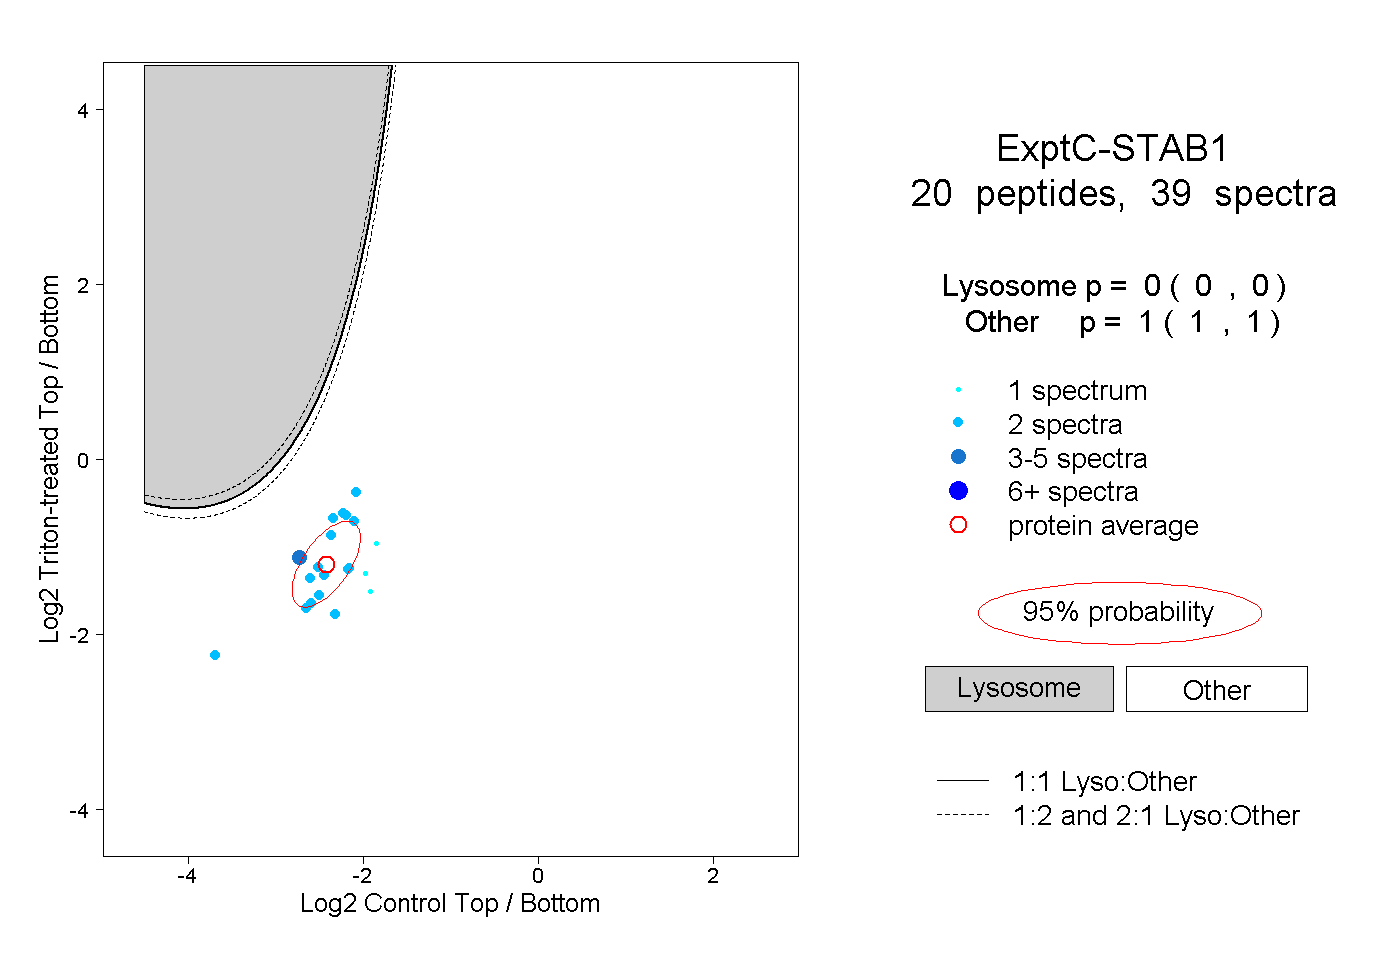
0.000 | 0.000
1.000 | 1.000
4peptides
spectra
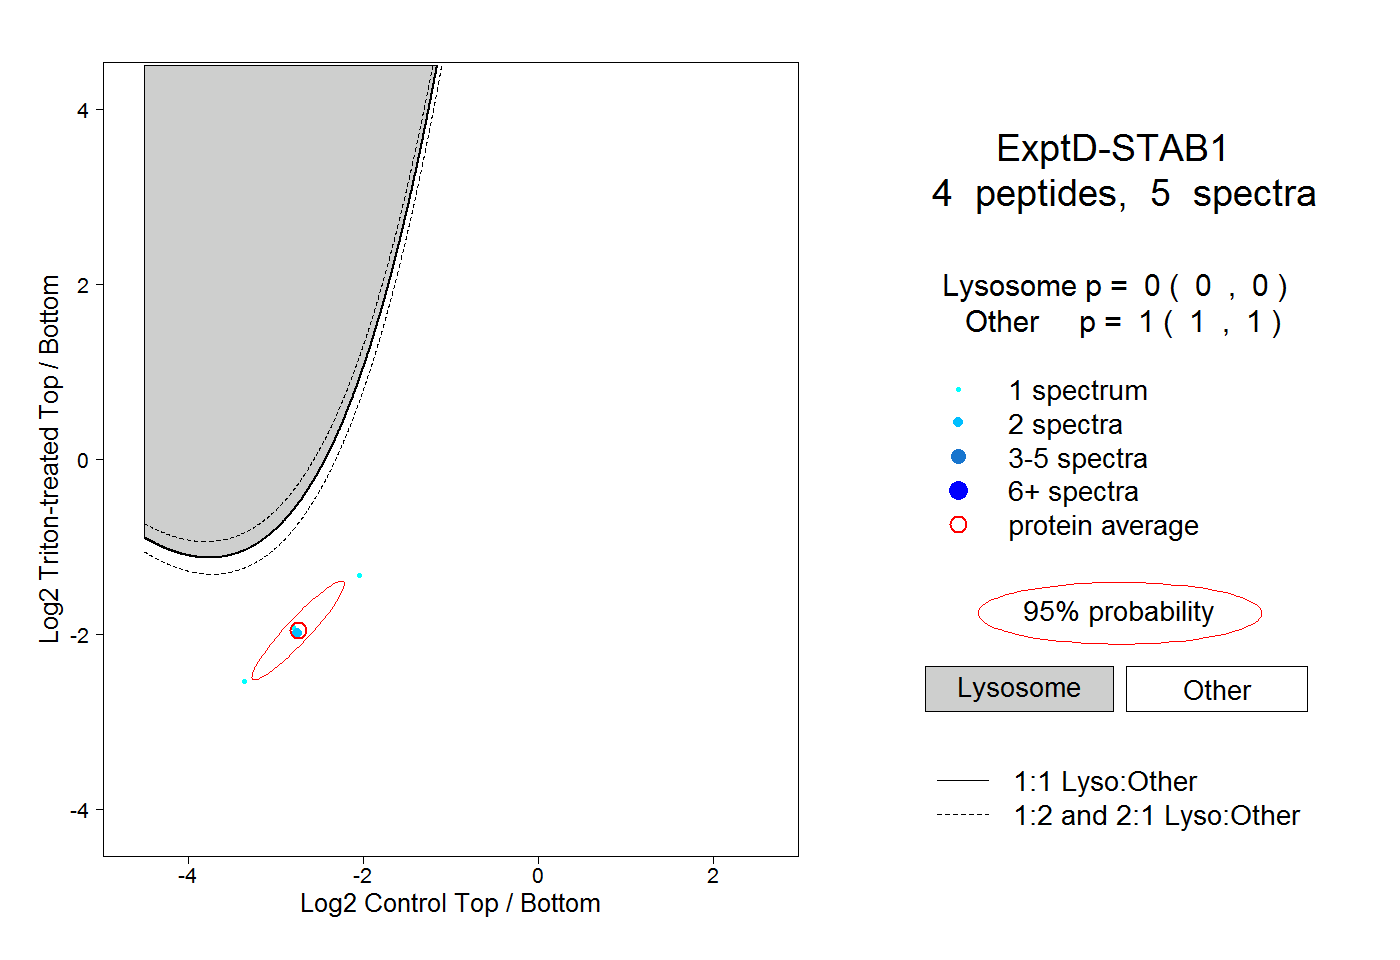
0.000 | 0.000
1.000 | 1.000