 30
30peptides
spectra
0.000 | 0.000
0.417 | 0.429
0.000 | 0.000
0.000 | 0.000
0.395 | 0.407
0.165 | 0.183
0.000 | 0.000
0.000 | 0.000
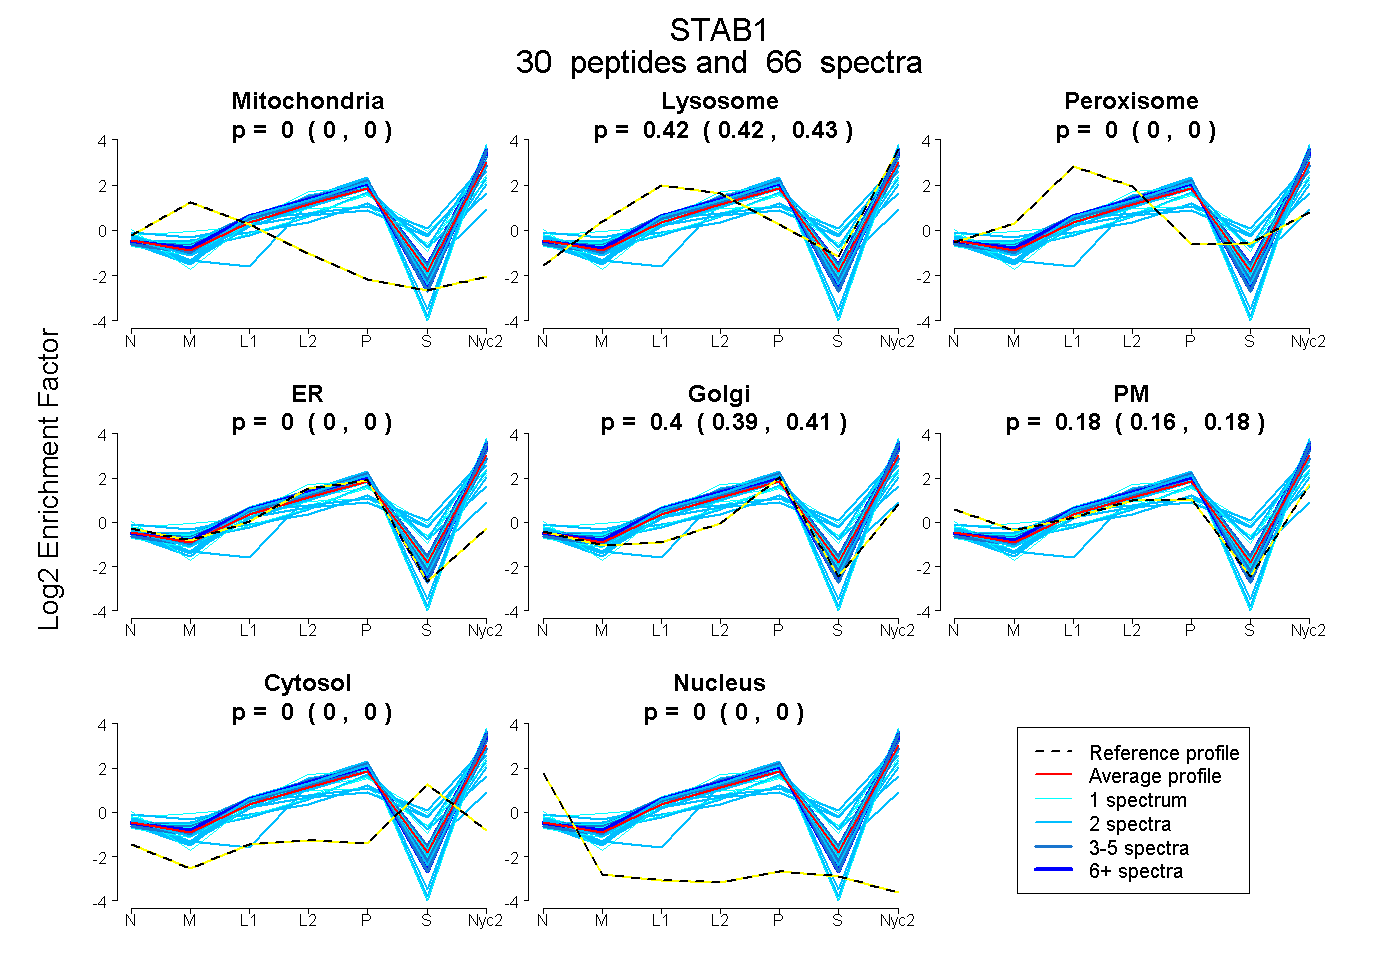
| Plot | Mito | Lyso | Perox | ER | Golgi | PM | Cytosol | Nucleus | |||||
| Expt A |
30 peptides |
66 spectra |
|
0.000 0.000 | 0.000 |
0.423 0.417 | 0.429 |
0.000 0.000 | 0.000 |
0.000 0.000 | 0.000 |
0.402 0.395 | 0.407 |
0.175 0.165 | 0.183 |
0.000 0.000 | 0.000 |
0.000 0.000 | 0.000 |
| 3 spectra, LCPSGWSR | 0.000 | 0.409 | 0.000 | 0.000 | 0.317 | 0.273 | 0.000 | 0.000 | ||
| 1 spectrum, ICVAIDECGLDTR | 0.000 | 0.496 | 0.000 | 0.000 | 0.325 | 0.000 | 0.179 | 0.000 | ||
| 2 spectra, YELQLR | 0.000 | 0.359 | 0.000 | 0.000 | 0.322 | 0.319 | 0.000 | 0.000 | ||
| 2 spectra, DVACQCR | 0.000 | 0.000 | 0.000 | 0.219 | 0.678 | 0.035 | 0.068 | 0.000 | ||
| 6 spectra, VGVISLGVR | 0.000 | 0.419 | 0.000 | 0.000 | 0.239 | 0.341 | 0.000 | 0.000 | ||
| 1 spectrum, CQEGFHGTACEMCELGR | 0.000 | 0.474 | 0.000 | 0.000 | 0.263 | 0.194 | 0.070 | 0.000 | ||
| 2 spectra, GCSYTCAK | 0.000 | 0.316 | 0.000 | 0.064 | 0.414 | 0.206 | 0.000 | 0.000 | ||
| 1 spectrum, GSVVSLSGCSQECWK | 0.000 | 0.377 | 0.000 | 0.000 | 0.106 | 0.377 | 0.140 | 0.000 | ||
| 1 spectrum, VAPGQR | 0.000 | 0.578 | 0.000 | 0.000 | 0.422 | 0.000 | 0.000 | 0.000 | ||
| 4 spectra, SGLSFSR | 0.000 | 0.516 | 0.000 | 0.000 | 0.406 | 0.078 | 0.000 | 0.000 | ||
| 3 spectra, LAALLR | 0.000 | 0.441 | 0.000 | 0.000 | 0.270 | 0.289 | 0.000 | 0.000 | ||
| 1 spectrum, VGNGGCHGLATCK | 0.000 | 0.522 | 0.000 | 0.000 | 0.268 | 0.210 | 0.000 | 0.000 | ||
| 2 spectra, FITHTPCTACAAIR | 0.000 | 0.304 | 0.000 | 0.089 | 0.334 | 0.273 | 0.000 | 0.000 | ||
| 2 spectra, TSCVCK | 0.000 | 0.434 | 0.000 | 0.000 | 0.005 | 0.380 | 0.180 | 0.000 | ||
| 1 spectrum, LTALVPSESAIR | 0.000 | 0.435 | 0.000 | 0.000 | 0.315 | 0.251 | 0.000 | 0.000 | ||
| 2 spectra, SILGIDIVR | 0.000 | 0.310 | 0.000 | 0.000 | 0.244 | 0.445 | 0.000 | 0.000 | ||
| 2 spectra, AHFLQGAFSEEELAR | 0.000 | 0.478 | 0.000 | 0.000 | 0.330 | 0.016 | 0.175 | 0.000 | ||
| 1 spectrum, LVAQIEAAK | 0.000 | 0.506 | 0.000 | 0.000 | 0.244 | 0.250 | 0.000 | 0.000 | ||
| 2 spectra, AVGGGQR | 0.000 | 0.290 | 0.000 | 0.000 | 0.197 | 0.513 | 0.000 | 0.000 | ||
| 3 spectra, VLLPPDVLHWEADTIPIPR | 0.000 | 0.429 | 0.000 | 0.000 | 0.352 | 0.219 | 0.000 | 0.000 | ||
| 4 spectra, ILLGPEGVPVR | 0.000 | 0.462 | 0.000 | 0.000 | 0.348 | 0.190 | 0.000 | 0.000 | ||
| 2 spectra, GGSWITPSFWNR | 0.000 | 0.436 | 0.000 | 0.000 | 0.452 | 0.112 | 0.000 | 0.000 | ||
| 2 spectra, LEELVR | 0.000 | 0.543 | 0.000 | 0.000 | 0.084 | 0.180 | 0.193 | 0.000 | ||
| 1 spectrum, EQGSPEACWR | 0.000 | 0.315 | 0.000 | 0.000 | 0.424 | 0.155 | 0.106 | 0.000 | ||
| 1 spectrum, VGLELLR | 0.000 | 0.103 | 0.000 | 0.000 | 0.137 | 0.761 | 0.000 | 0.000 | ||
| 2 spectra, SATCQVTPDR | 0.000 | 0.328 | 0.000 | 0.000 | 0.297 | 0.374 | 0.000 | 0.000 | ||
| 6 spectra, ANQIGLVLLR | 0.000 | 0.505 | 0.000 | 0.000 | 0.362 | 0.134 | 0.000 | 0.000 | ||
| 2 spectra, EGSIYLNDFAR | 0.000 | 0.512 | 0.000 | 0.000 | 0.302 | 0.186 | 0.000 | 0.000 | ||
| 2 spectra, TLPELVR | 0.000 | 0.522 | 0.000 | 0.000 | 0.472 | 0.000 | 0.006 | 0.000 | ||
| 2 spectra, CDIHTK | 0.000 | 0.275 | 0.000 | 0.000 | 0.521 | 0.080 | 0.124 | 0.000 |
| Plot | Mito | Lyso or Perox | ER | Golgi | PM | Cytosol | Nucleus | ||||||
| Expt B |
3 peptides |
4 spectra |
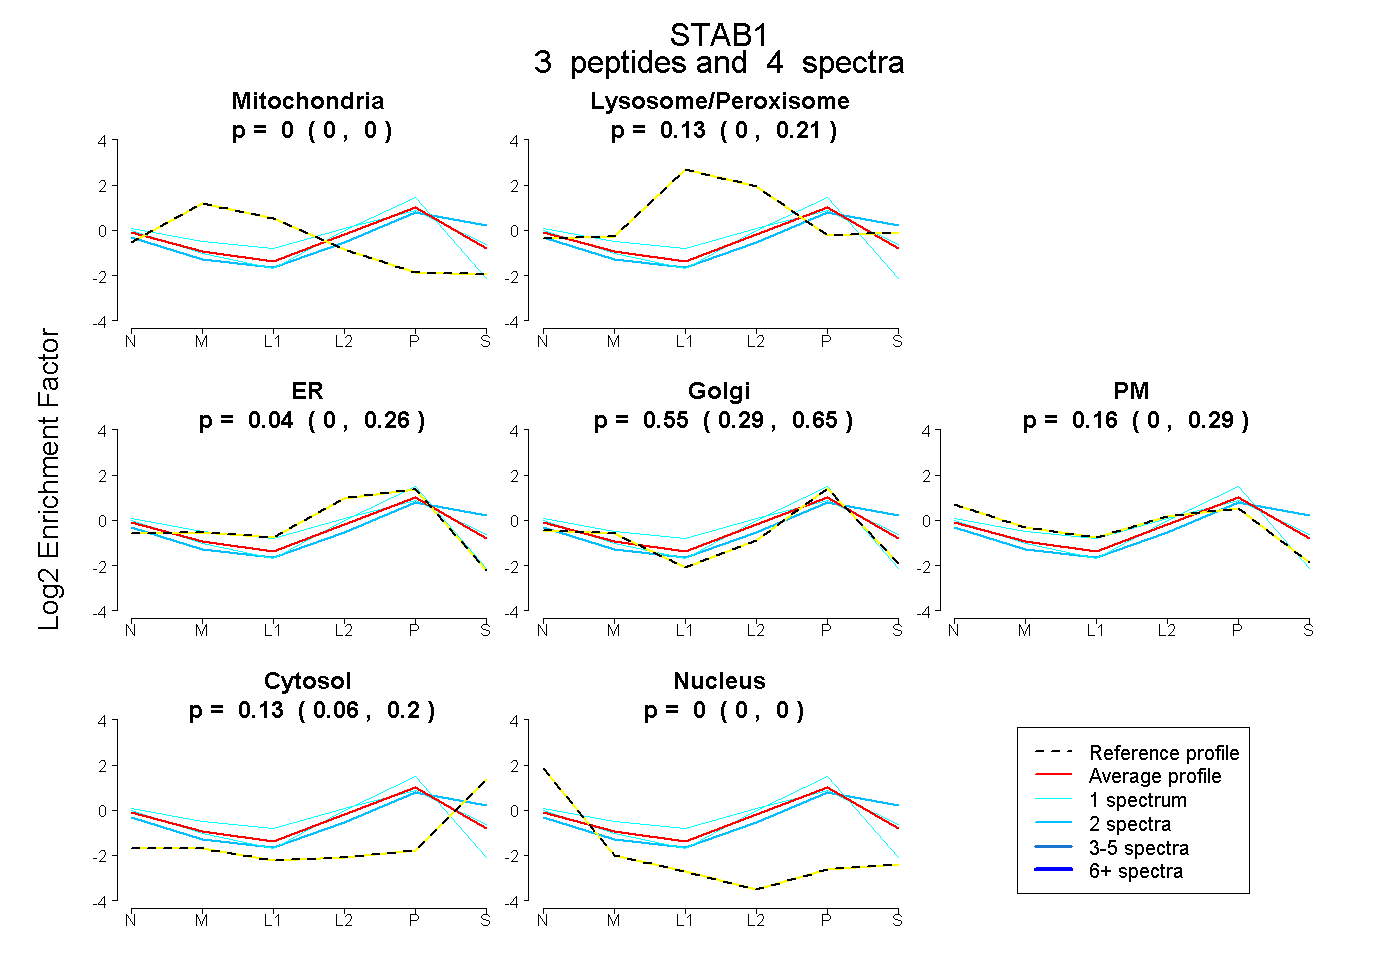 |
0.000 0.000 | 0.000 |
0.134 0.000 | 0.205 |
0.035 0.000 | 0.264 |
0.548 0.287 | 0.651 |
0.155 0.000 | 0.294 |
0.128 0.058 | 0.199 |
0.000 0.000 | 0.000 |
|||
| Plot | Lyso | Other | |||||||||||
| Expt C |
20 peptides |
39 spectra |
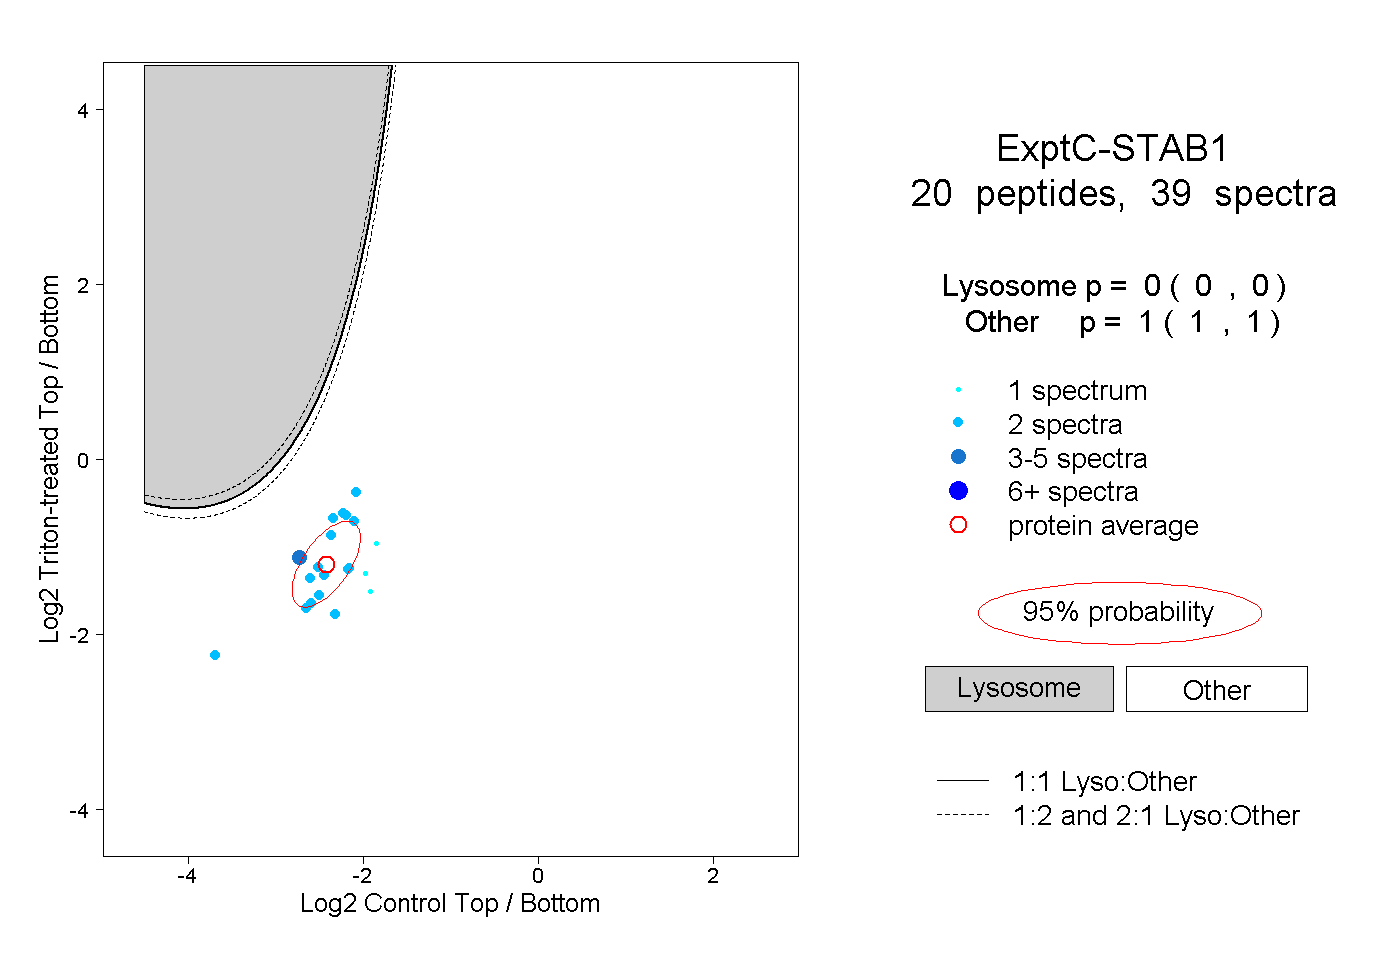 |
0.000 0.000 | 0.000 |
1.000 1.000 | 1.000 |
||||||||
| Plot | Lyso | Other | |||||||||||
| Expt D |
4 peptides |
5 spectra |
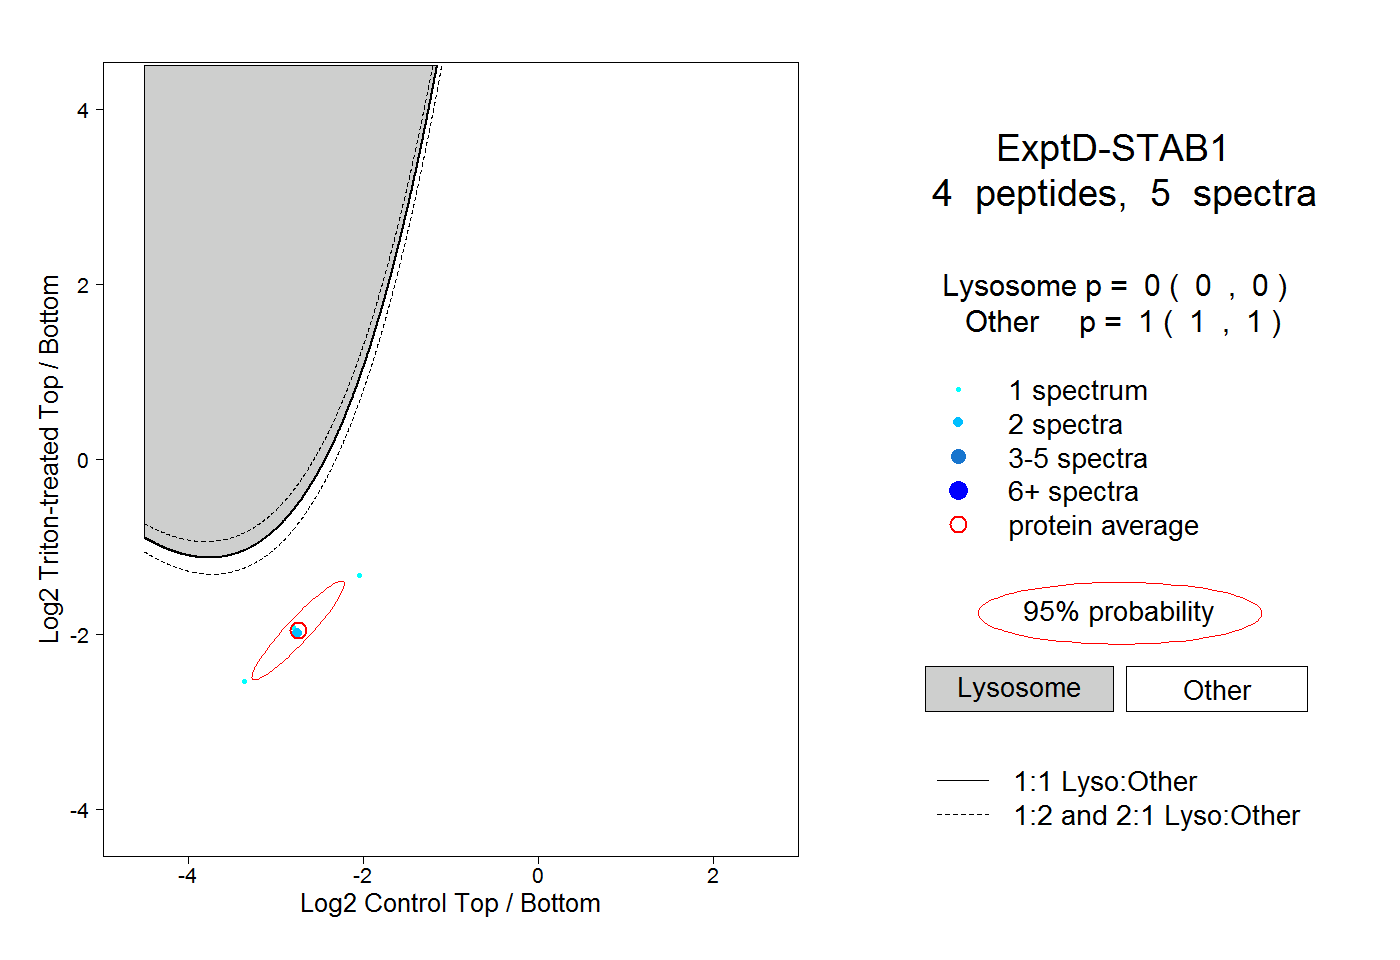 |
0.000 0.000 | 0.000 |
1.000 1.000 | 1.000 |