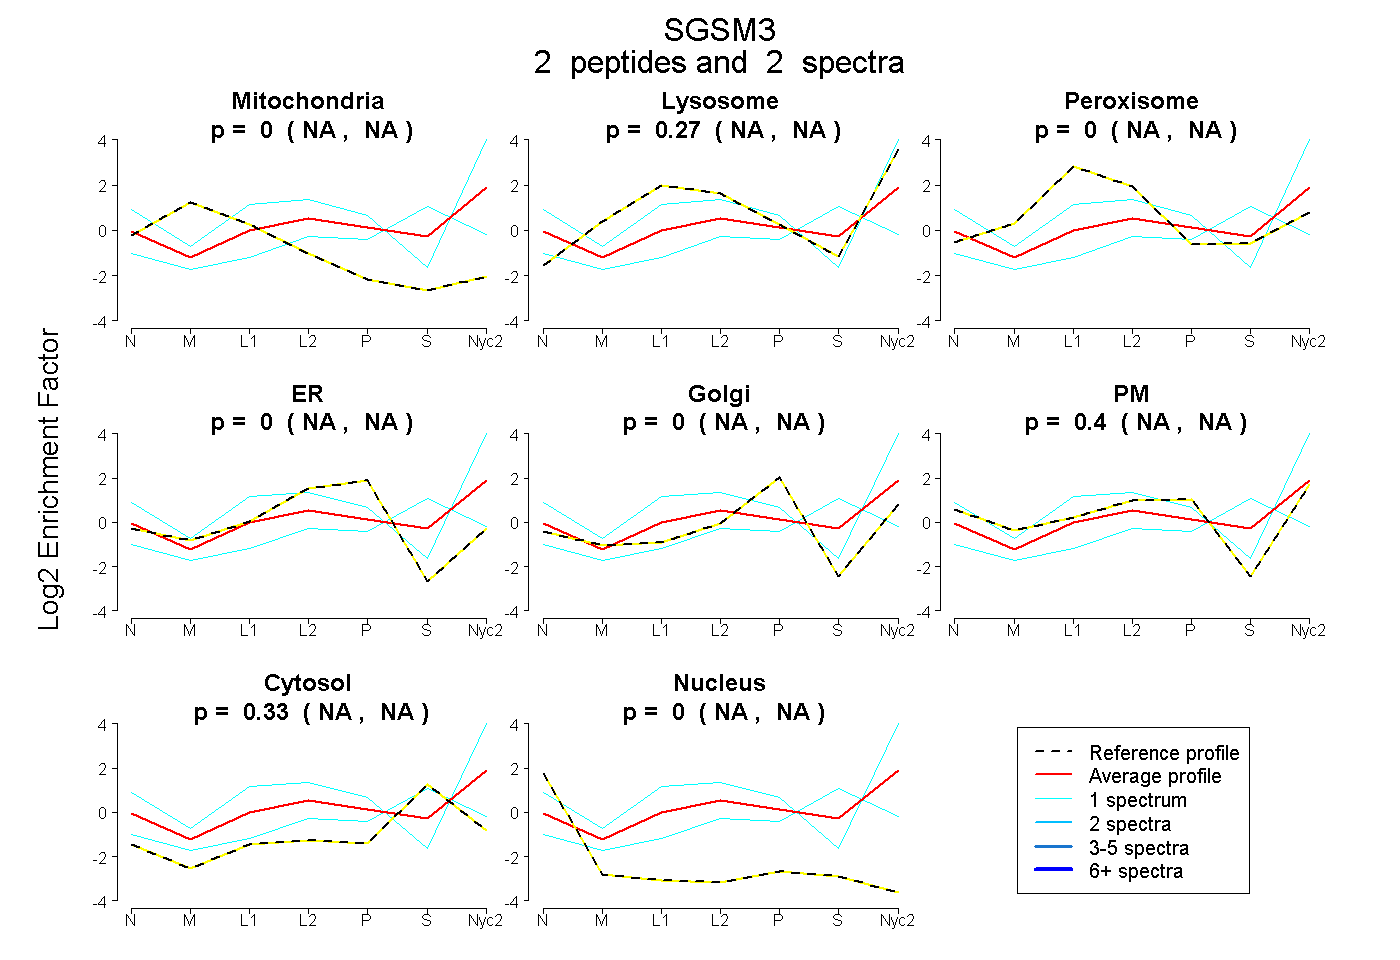
 2
2peptides
spectra
NA | NA
NA | NA
NA | NA
NA | NA
NA | NA
NA | NA
NA | NA
NA | NA
| Plot | Mito | Lyso | Perox | ER | Golgi | PM | Cytosol | Nucleus | |||||
| Expt A |
2 peptides |
2 spectra |
|
0.000 NA | NA |
0.266 NA | NA |
0.000 NA | NA |
0.000 NA | NA |
0.000 NA | NA |
0.401 NA | NA |
0.333 NA | NA |
0.000 NA | NA |
| 1 spectrum, SPGWVQIK | 0.000 | 0.456 | 0.000 | 0.000 | 0.000 | 0.544 | 0.000 | 0.000 | ||
| 1 spectrum, HDDDELGFR | 0.000 | 0.098 | 0.000 | 0.114 | 0.000 | 0.033 | 0.755 | 0.000 |
| Plot | Lyso | Other | |||||||||||
| Expt D |
1 peptide |
1 spectrum |
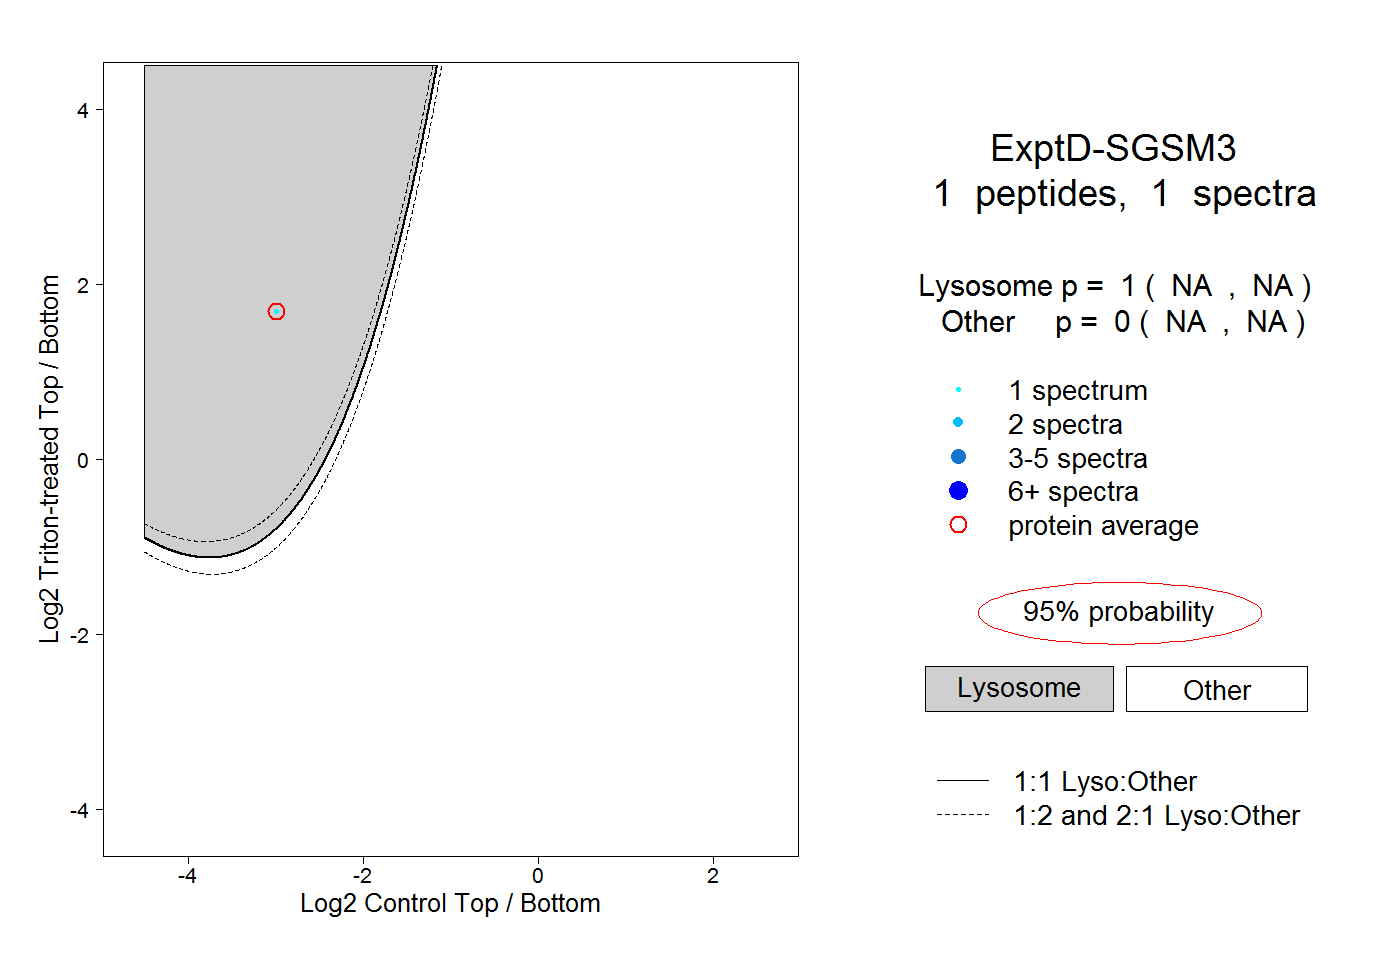 |
1.000 NA | NA |
0.000 NA | NA |