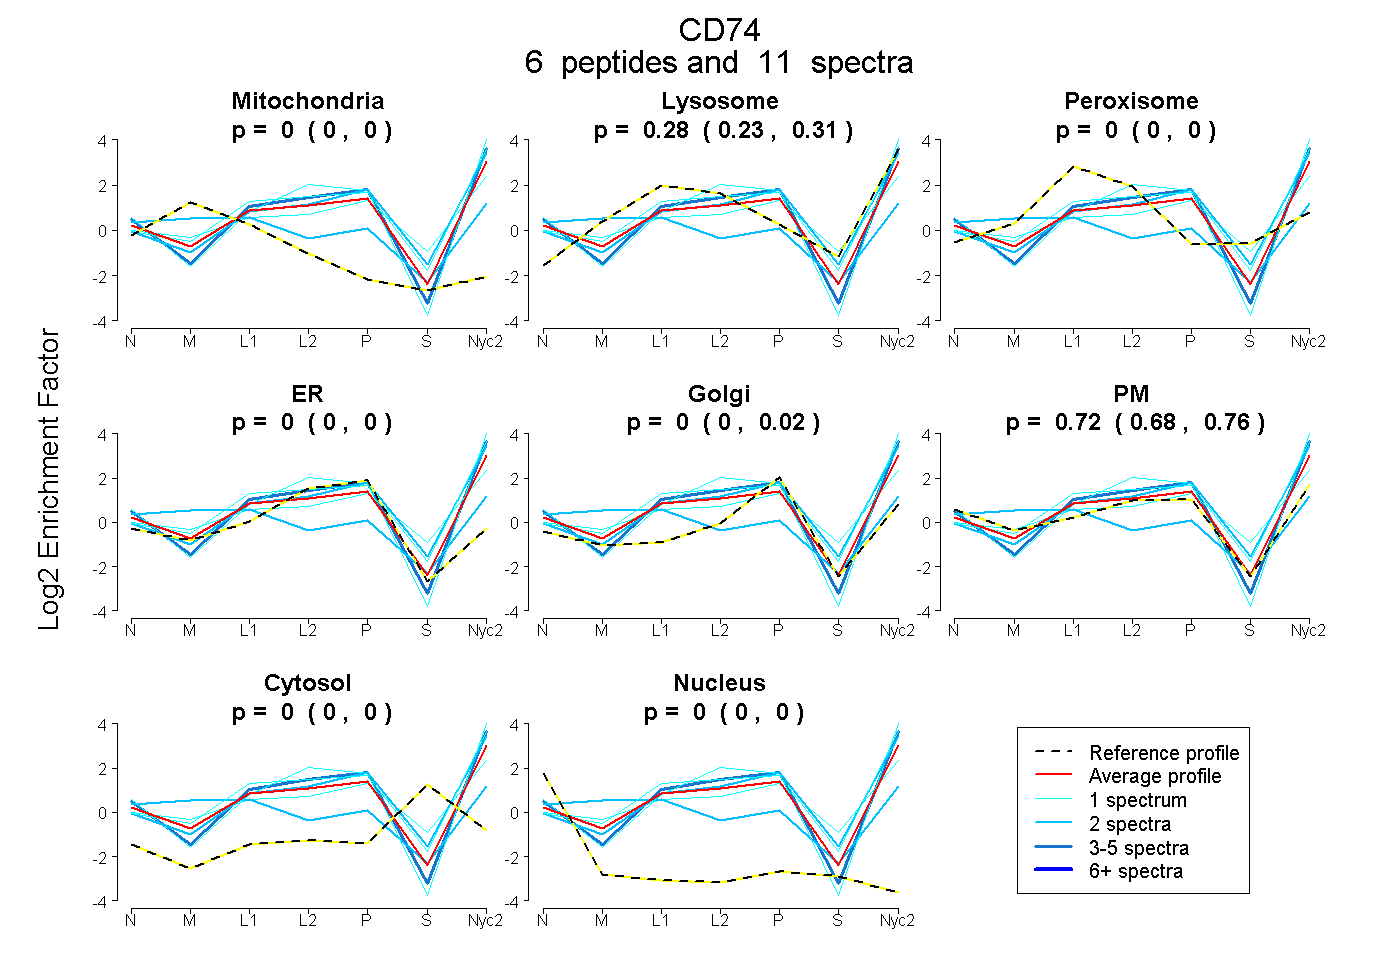
 6
6peptides
spectra
0.000 | 0.000
0.230 | 0.314
0.000 | 0.000
0.000 | 0.000
0.000 | 0.019
0.676 | 0.760
0.000 | 0.000
0.000 | 0.000
| Plot | Mito | Lyso | Perox | ER | Golgi | PM | Cytosol | Nucleus | |||||
| Expt A |
6 peptides |
11 spectra |
|
0.000 0.000 | 0.000 |
0.276 0.230 | 0.314 |
0.000 0.000 | 0.000 |
0.000 0.000 | 0.000 |
0.000 0.000 | 0.019 |
0.724 0.676 | 0.760 |
0.000 0.000 | 0.000 |
0.000 0.000 | 0.000 |
| 1 spectrum, QWLLFEMSK | 0.000 | 0.191 | 0.000 | 0.000 | 0.000 | 0.809 | 0.000 | 0.000 | ||
| 2 spectra, LTVTSQNLQLENLR | 0.308 | 0.123 | 0.000 | 0.000 | 0.000 | 0.569 | 0.000 | 0.000 | ||
| 1 spectrum, VFESWMK | 0.000 | 0.519 | 0.000 | 0.000 | 0.000 | 0.481 | 0.000 | 0.000 | ||
| 2 spectra, SAKPVSPMR | 0.000 | 0.447 | 0.000 | 0.000 | 0.162 | 0.391 | 0.000 | 0.000 | ||
| 1 spectrum, GSFPENLK | 0.000 | 0.367 | 0.000 | 0.000 | 0.142 | 0.415 | 0.076 | 0.000 | ||
| 4 spectra, APESNCNR | 0.000 | 0.218 | 0.000 | 0.000 | 0.000 | 0.782 | 0.000 | 0.000 |
| Plot | Lyso | Other | |||||||||||
| Expt C |
2 peptides |
7 spectra |
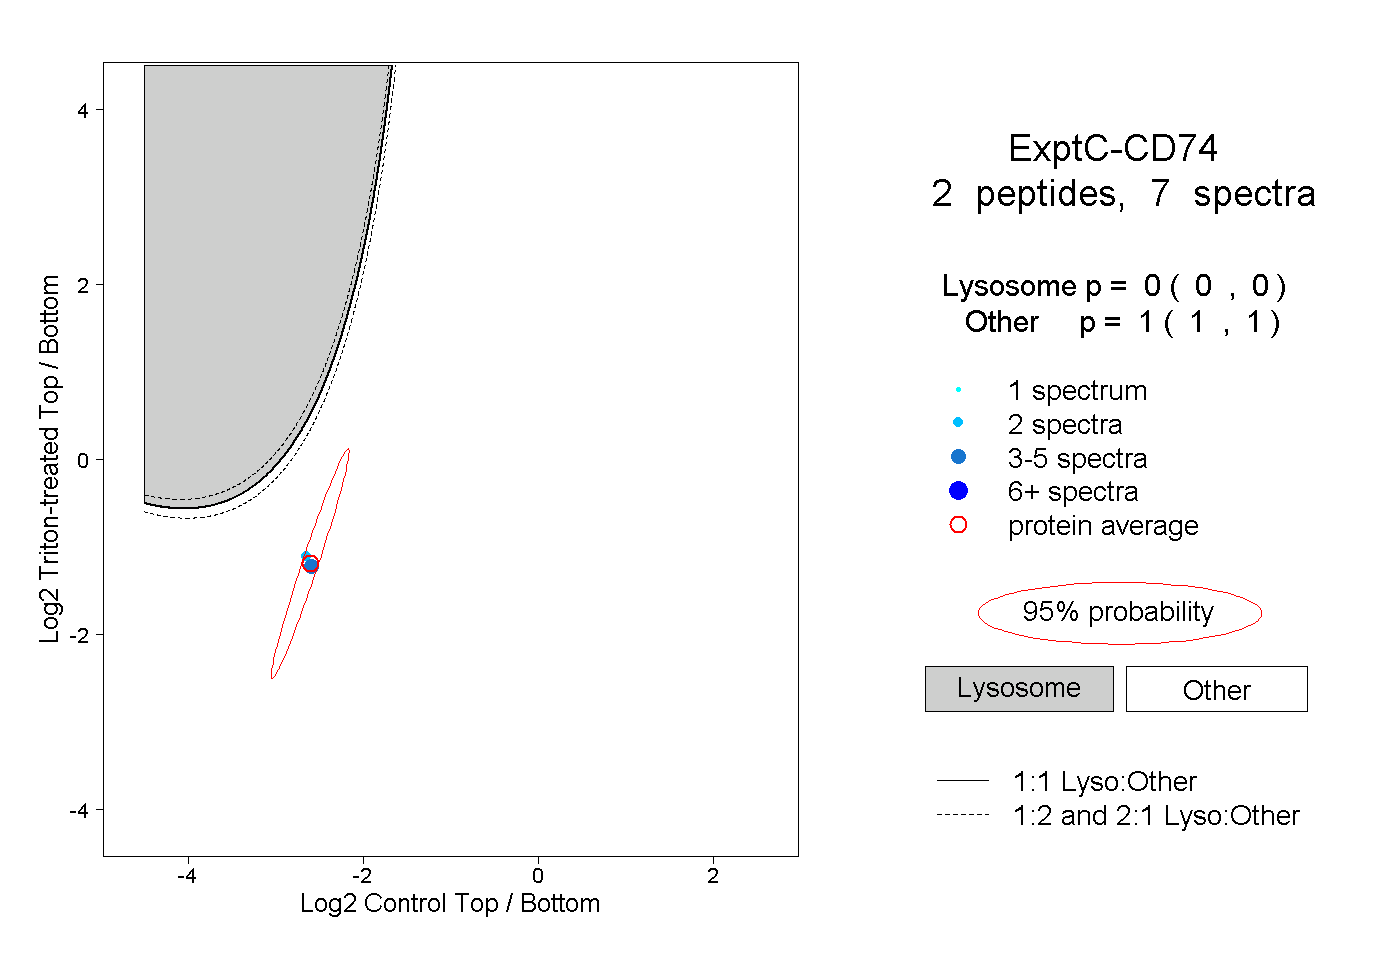 |
0.000 0.000 | 0.000 |
1.000 1.000 | 1.000 |