 2
2peptides
spectra
NA | NA
NA | NA
NA | NA
NA | NA
NA | NA
NA | NA
NA | NA
NA | NA
1peptide
spectrum
NA | NA
NA | NA
NA | NA
NA | NA
NA | NA
NA | NA
NA | NA
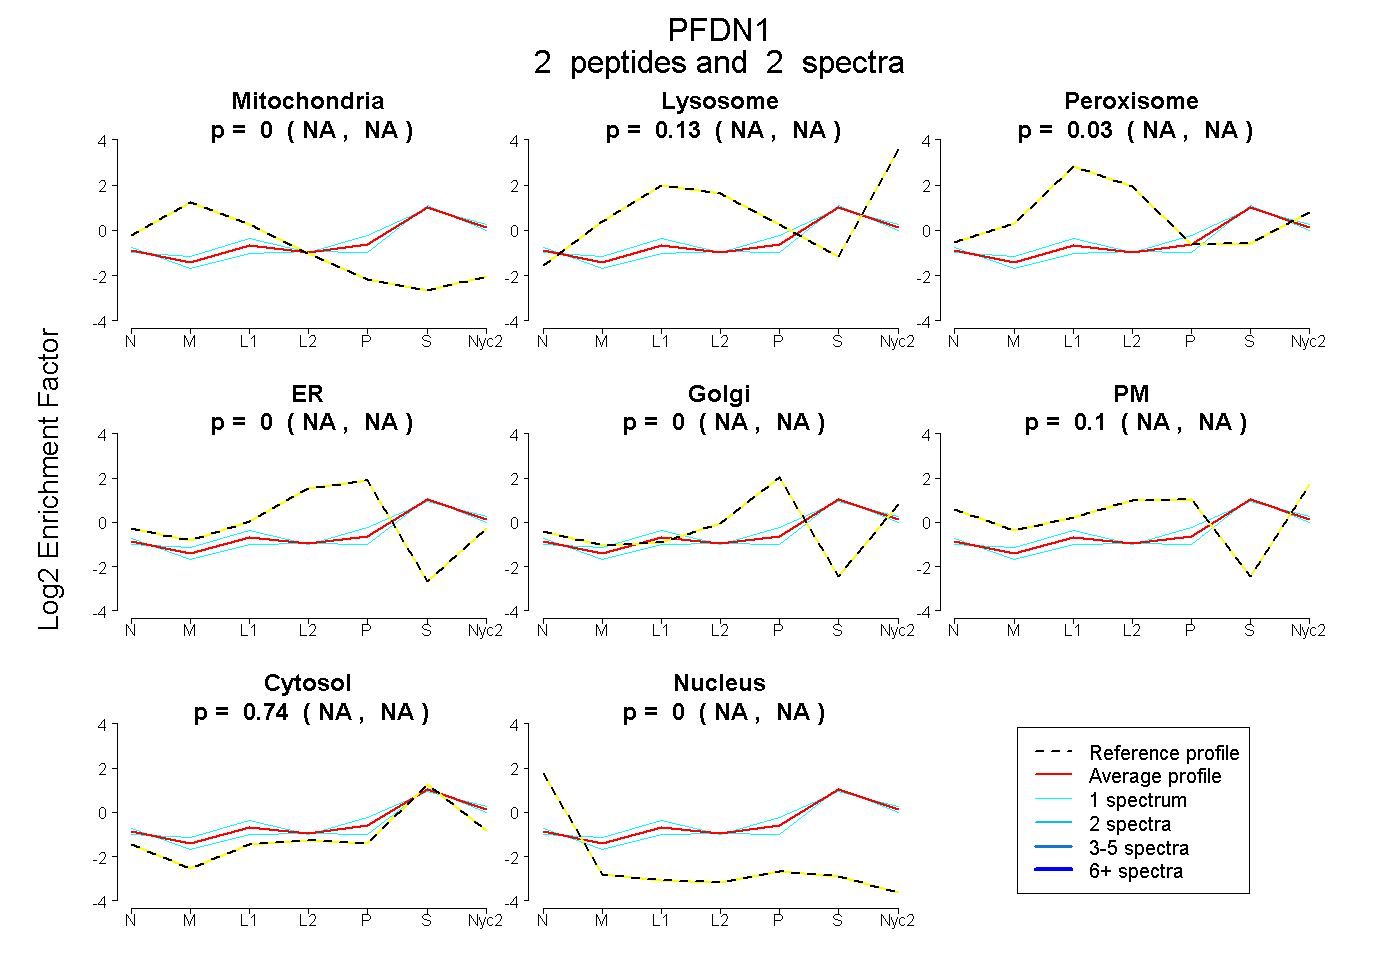
| Plot | Mito | Lyso | Perox | ER | Golgi | PM | Cytosol | Nucleus | |||||
| Expt A |
2 peptides |
2 spectra |
|
0.000 NA | NA |
0.133 NA | NA |
0.025 NA | NA |
0.000 NA | NA |
0.000 NA | NA |
0.098 NA | NA |
0.744 NA | NA |
0.000 NA | NA |
||
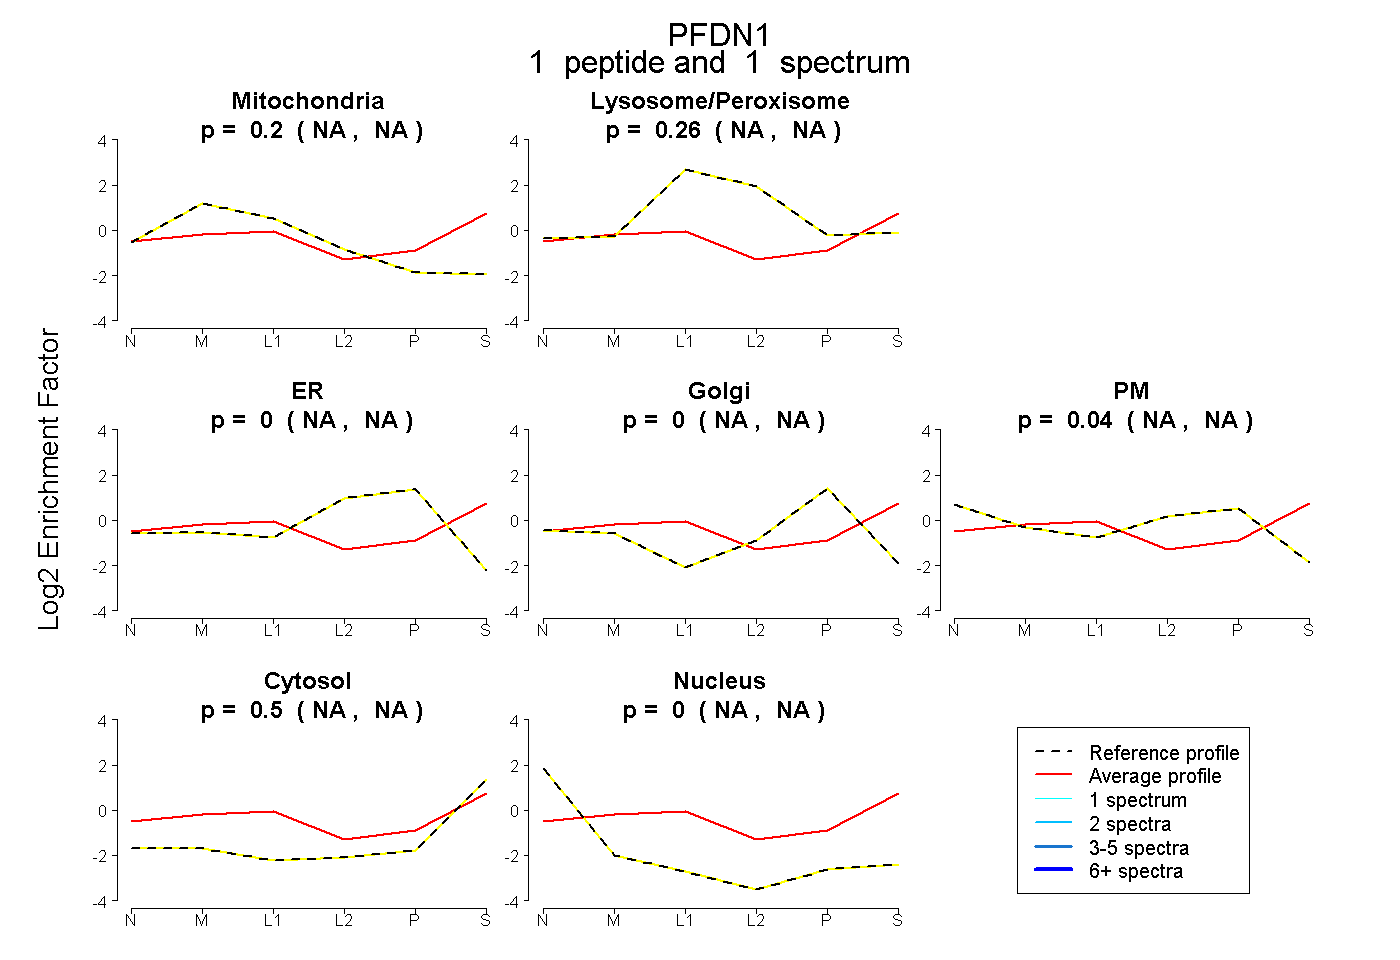
| Plot | Mito | Lyso or Perox | ER | Golgi | PM | Cytosol | Nucleus | ||||||
| Expt B |
1 peptide |
1 spectrum |
|
0.205 NA | NA |
0.262 NA | NA |
0.000 NA | NA |
0.000 NA | NA |
0.038 NA | NA |
0.496 NA | NA |
0.000 NA | NA |
| 1 spectrum, LADIQIEQLNR | 0.205 | 0.262 | 0.000 | 0.000 | 0.038 | 0.496 | 0.000 |
| Plot | Lyso | Other | |||||||||||
| Expt C |
4 peptides |
8 spectra |
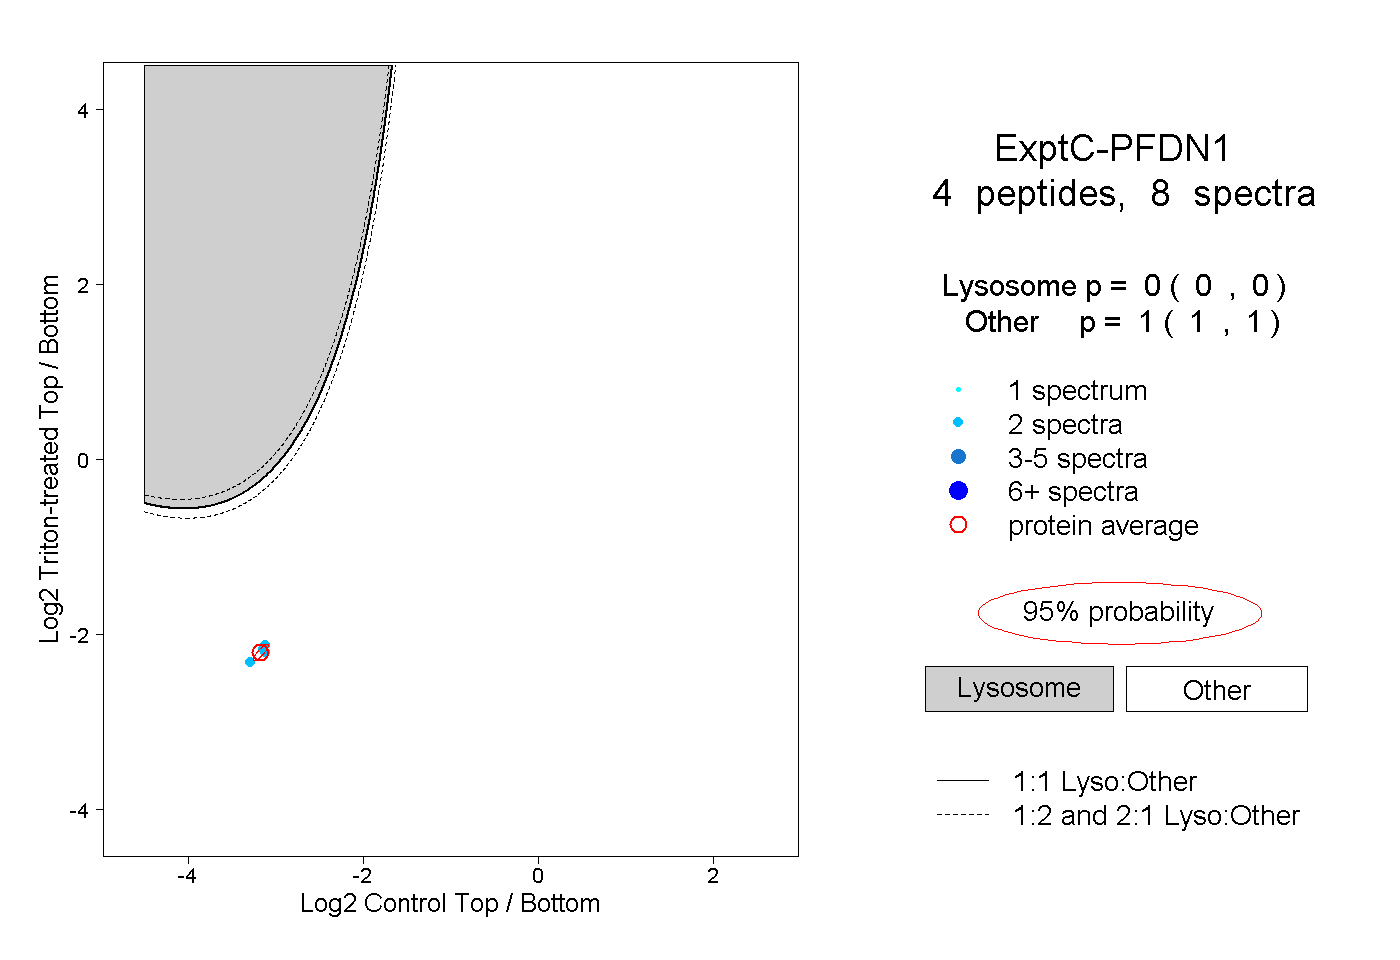 |
0.000 0.000 | 0.000 |
1.000 1.000 | 1.000 |