 4
4peptides
spectra
0.000 | 0.016
0.000 | 0.000
0.000 | 0.081
0.083 | 0.436
0.000 | 0.102
0.000 | 0.243
0.194 | 0.307
0.234 | 0.350
1peptide
spectrum
NA | NA
NA | NA
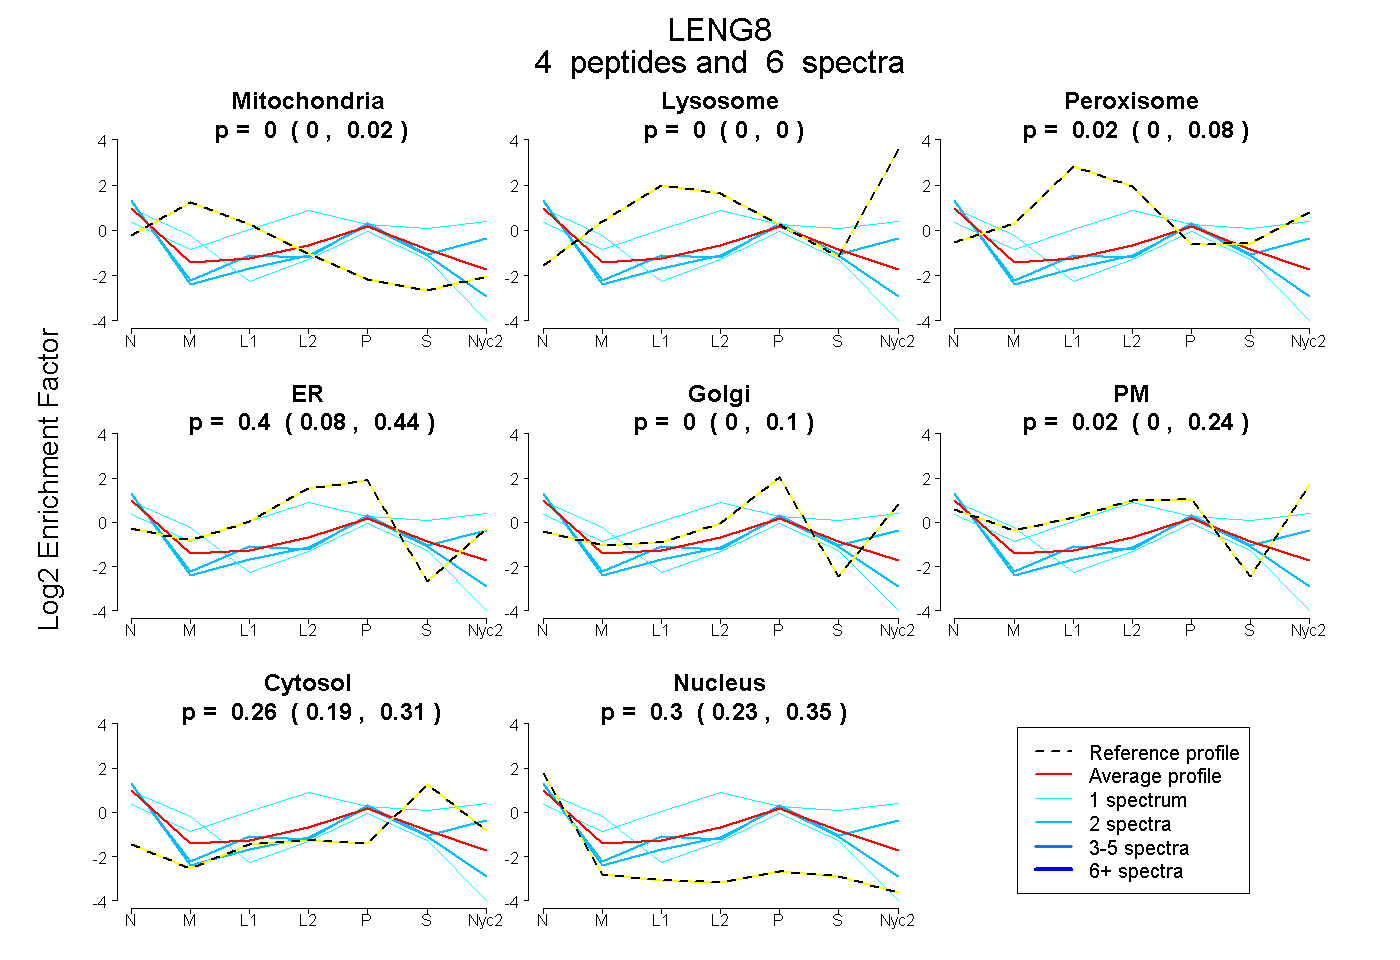
| Plot | Mito | Lyso | Perox | ER | Golgi | PM | Cytosol | Nucleus | |||||
| Expt A |
4 peptides |
6 spectra |
|
0.000 0.000 | 0.016 |
0.000 0.000 | 0.000 |
0.016 0.000 | 0.081 |
0.399 0.083 | 0.436 |
0.000 0.000 | 0.102 |
0.023 0.000 | 0.243 |
0.265 0.194 | 0.307 |
0.297 0.234 | 0.350 |
||
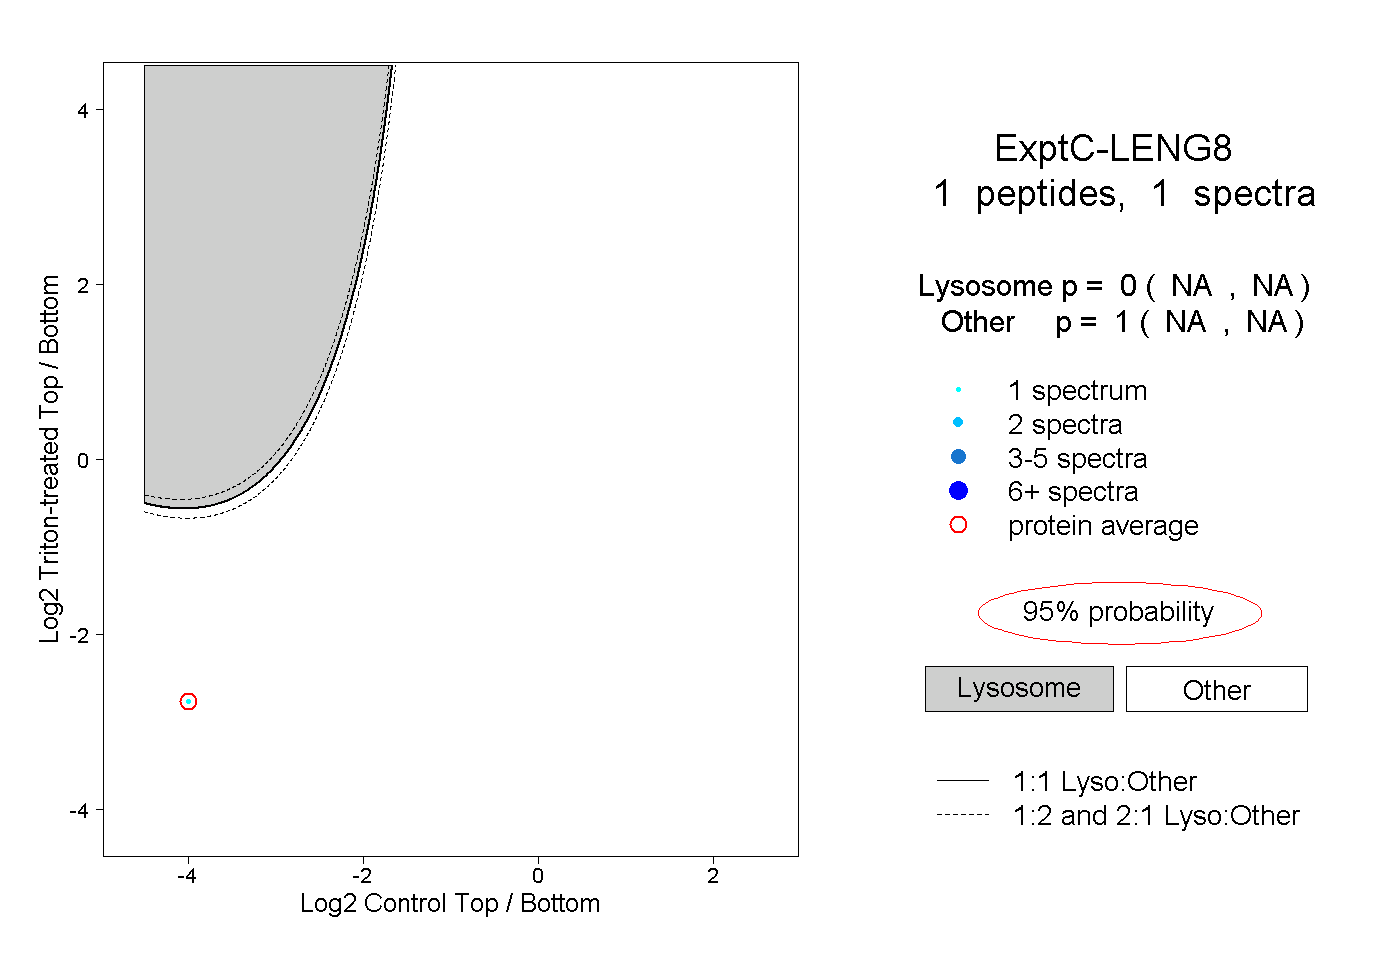
| Plot | Lyso | Other | |||||||||||
| Expt C |
1 peptide |
1 spectrum |
|
0.000 NA | NA |
1.000 NA | NA |