 2
2peptides
spectra
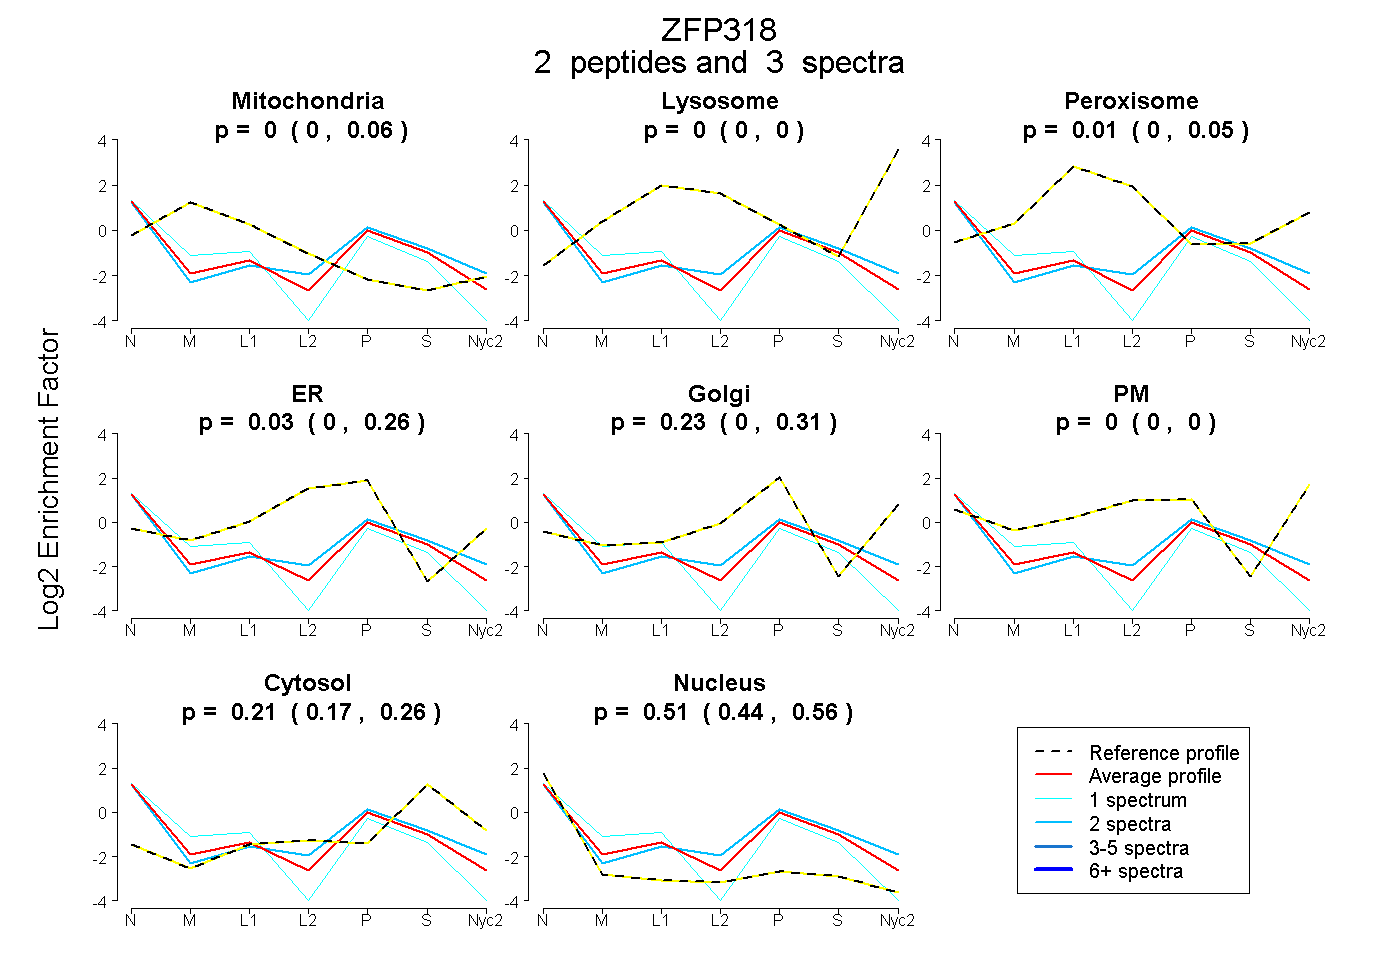
0.000 | 0.057
0.000 | 0.000
0.000 | 0.047
0.000 | 0.265
0.000 | 0.309
0.000 | 0.000
0.166 | 0.257
0.440 | 0.560
1peptide
spectra
0.000 | 0.000
1.000 | 1.000
| Plot | Mito | Lyso | Perox | ER | Golgi | PM | Cytosol | Nucleus | |||||
| Expt A |
2 peptides |
3 spectra |
|
0.000 0.000 | 0.057 |
0.000 0.000 | 0.000 |
0.012 0.000 | 0.047 |
0.031 0.000 | 0.265 |
0.235 0.000 | 0.309 |
0.000 0.000 | 0.000 |
0.213 0.166 | 0.257 |
0.508 0.440 | 0.560 |
||
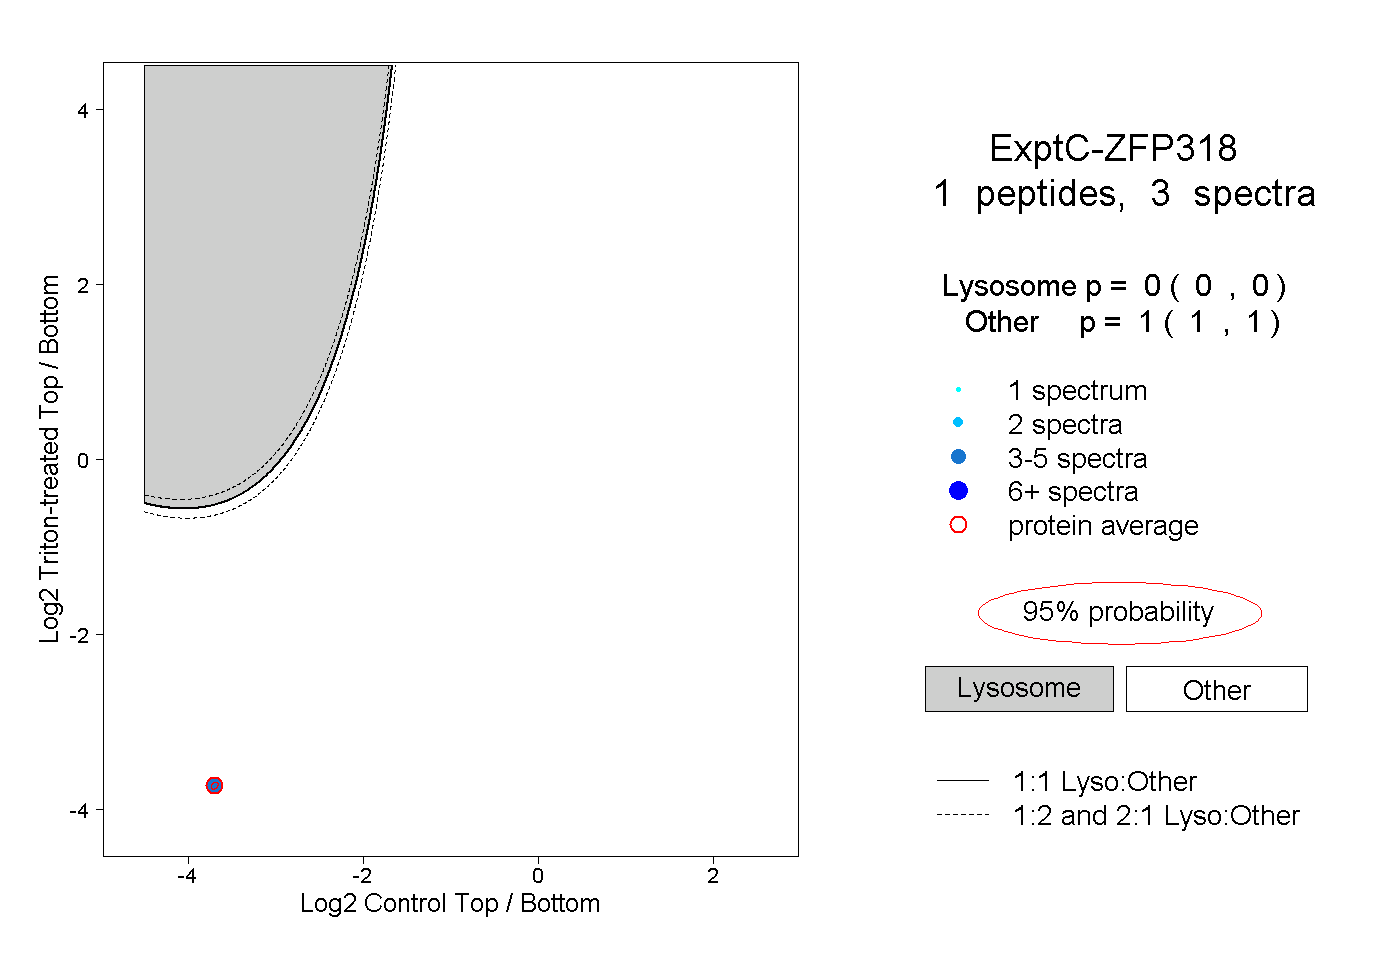
| Plot | Lyso | Other | |||||||||||
| Expt C |
1 peptide |
3 spectra |
|
0.000 0.000 | 0.000 |
1.000 1.000 | 1.000 |