 2
2peptides
spectra
0.591 | 0.752
0.000 | 0.231
0.000 | 0.210
0.000 | 0.030
0.000 | 0.087
0.000 | 0.146
0.000 | 0.101
0.000 | 0.000
| Plot | Mito | Lyso | Perox | ER | Golgi | PM | Cytosol | Nucleus | |||||
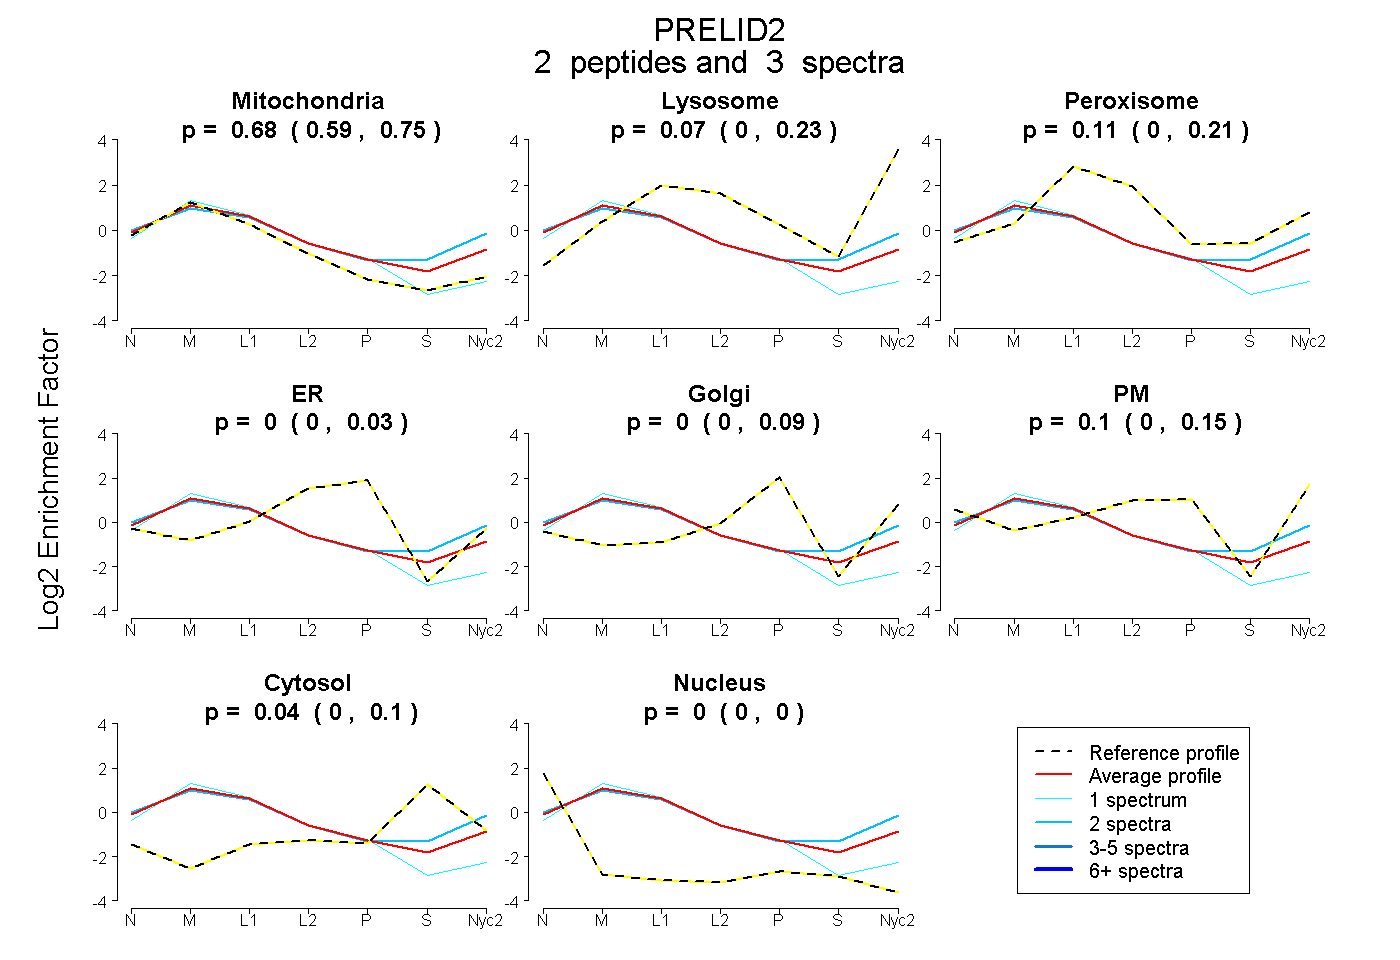
| Expt A |
2 peptides |
3 spectra |
|
0.677 0.591 | 0.752 |
0.073 0.000 | 0.231 |
0.112 0.000 | 0.210 |
0.000 0.000 | 0.030 |
0.000 0.000 | 0.087 |
0.097 0.000 | 0.146 |
0.041 0.000 | 0.101 |
0.000 0.000 | 0.000 |
| 1 spectrum, IMEMLLK | 0.857 | 0.000 | 0.000 | 0.143 | 0.000 | 0.000 | 0.000 | 0.000 | ||
| 2 spectra, IAICQNVVPEVLR | 0.569 | 0.189 | 0.073 | 0.000 | 0.000 | 0.067 | 0.101 | 0.000 |
| Plot | Lyso | Other | |||||||||||
| Expt C |
1 peptide |
2 spectra |
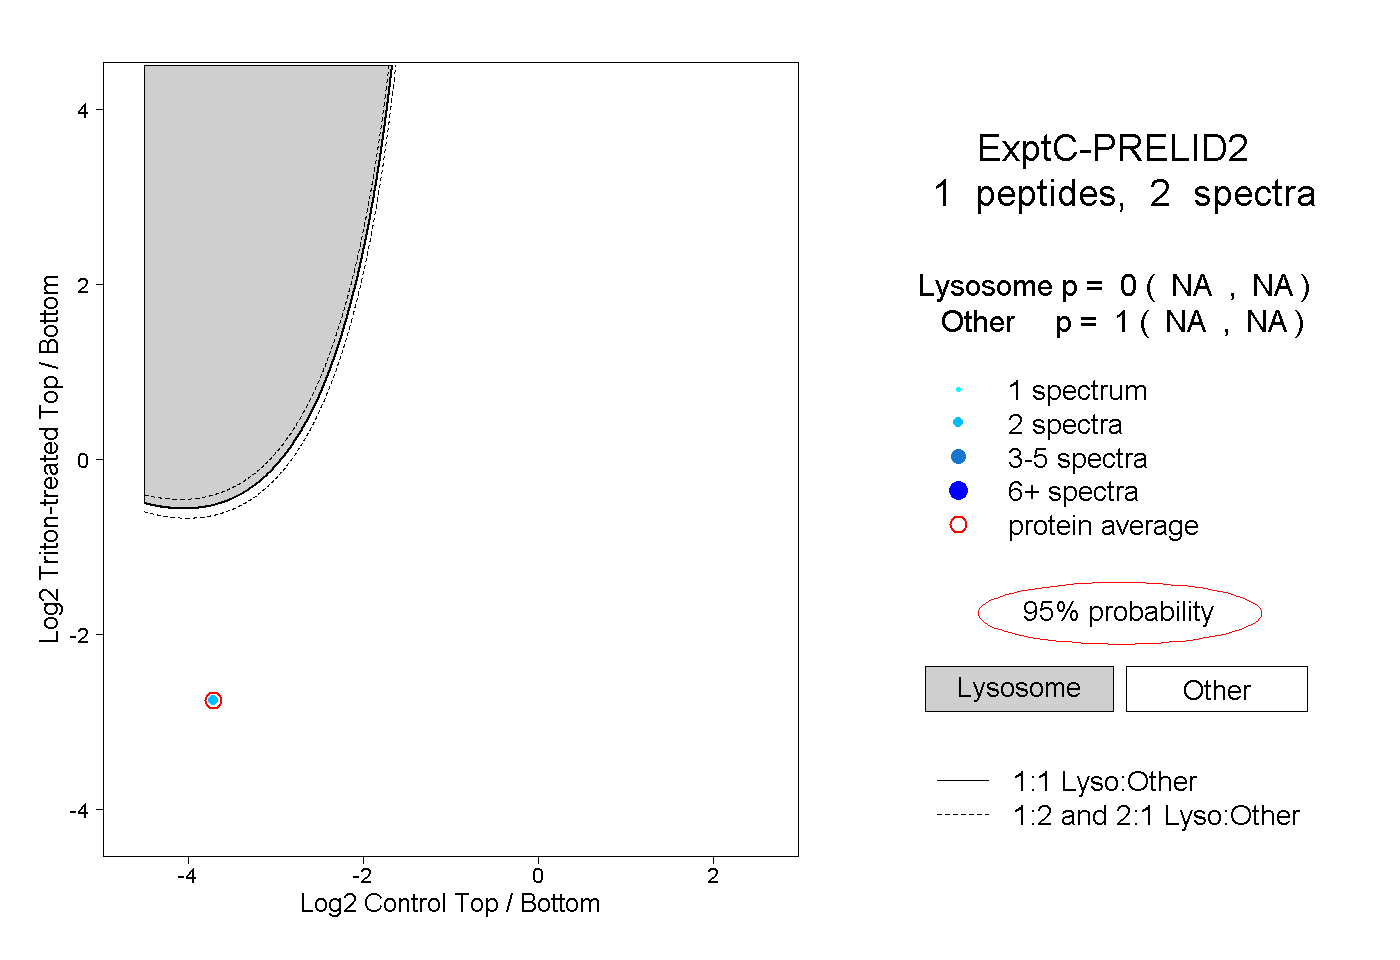 |
0.000 NA | NA |
1.000 NA | NA |