8
8peptides
spectra
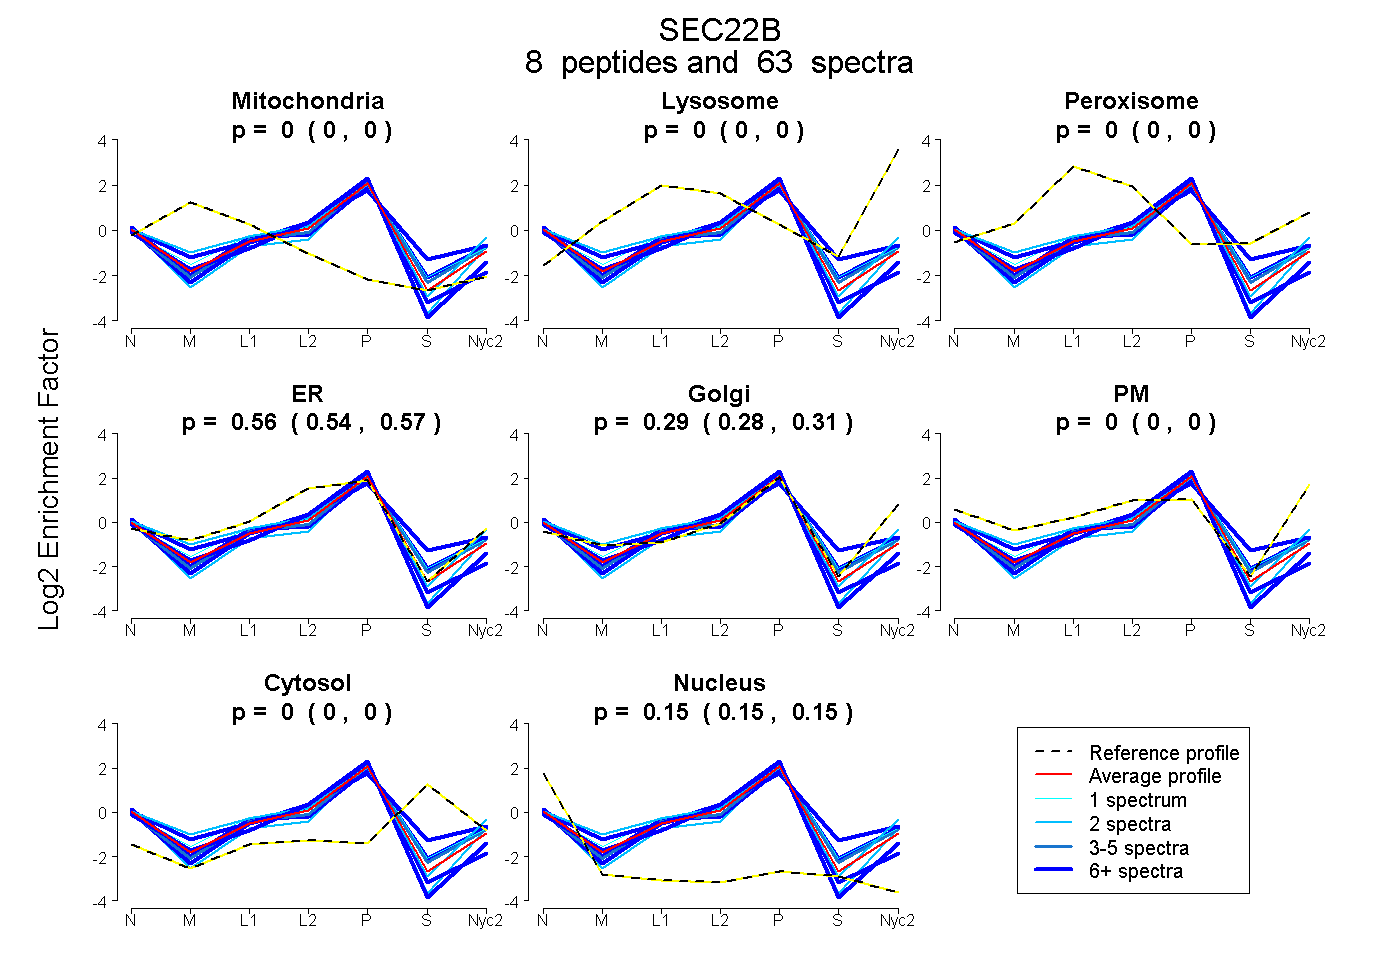
0.000 | 0.000
0.000 | 0.000
0.000 | 0.000
0.542 | 0.569
0.277 | 0.308
0.000 | 0.000
0.000 | 0.000
0.145 | 0.153
5peptides
spectra
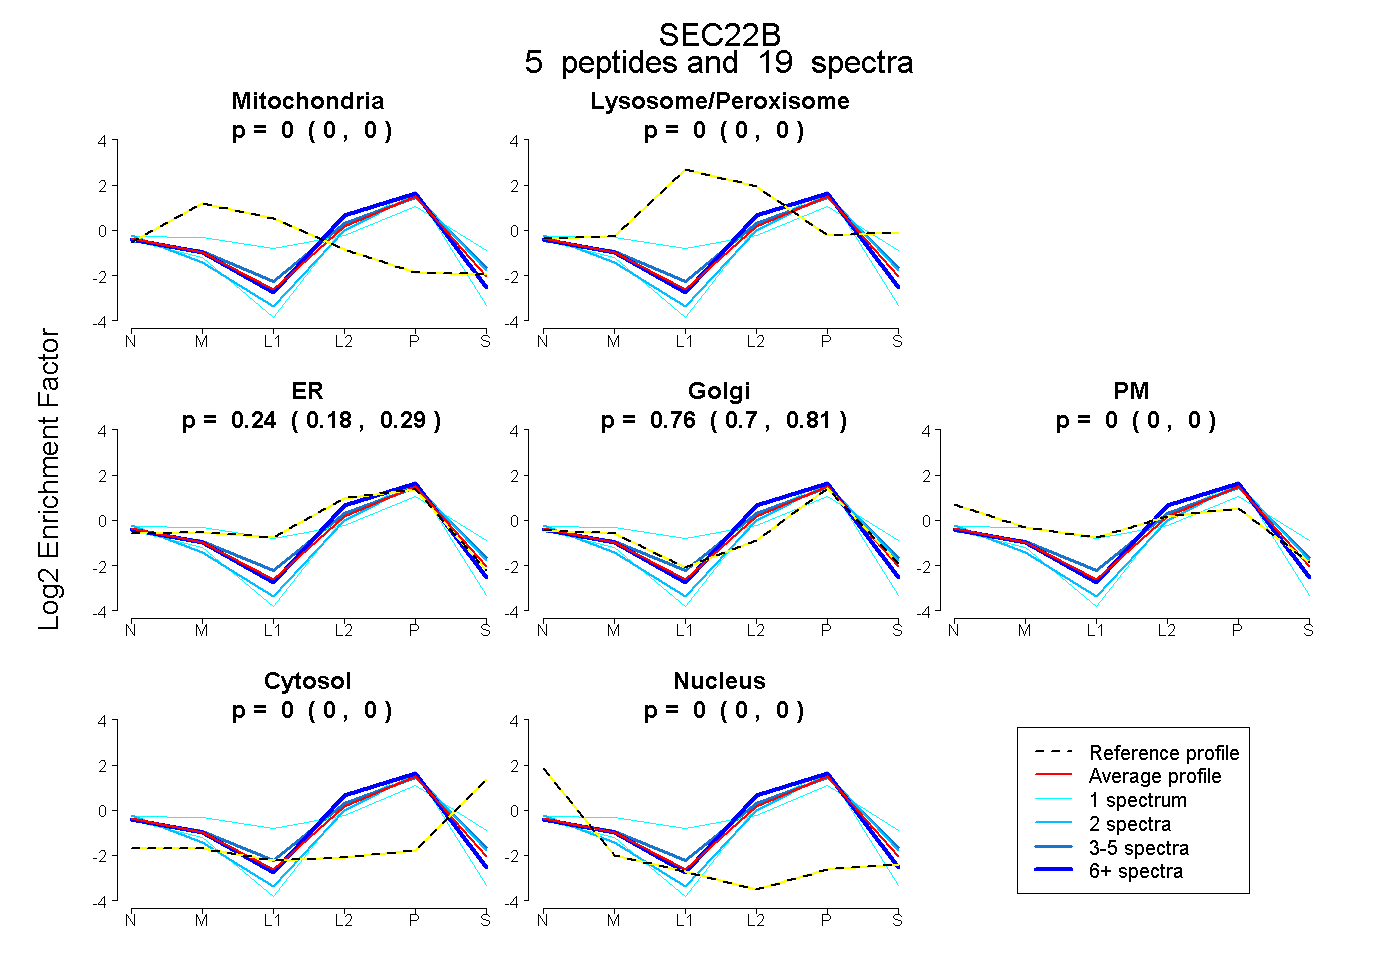
0.000 | 0.000
0.000 | 0.000
0.184 | 0.288
0.704 | 0.807
0.000 | 0.000
0.000 | 0.000
0.000 | 0.000