 1
1peptide
spectra
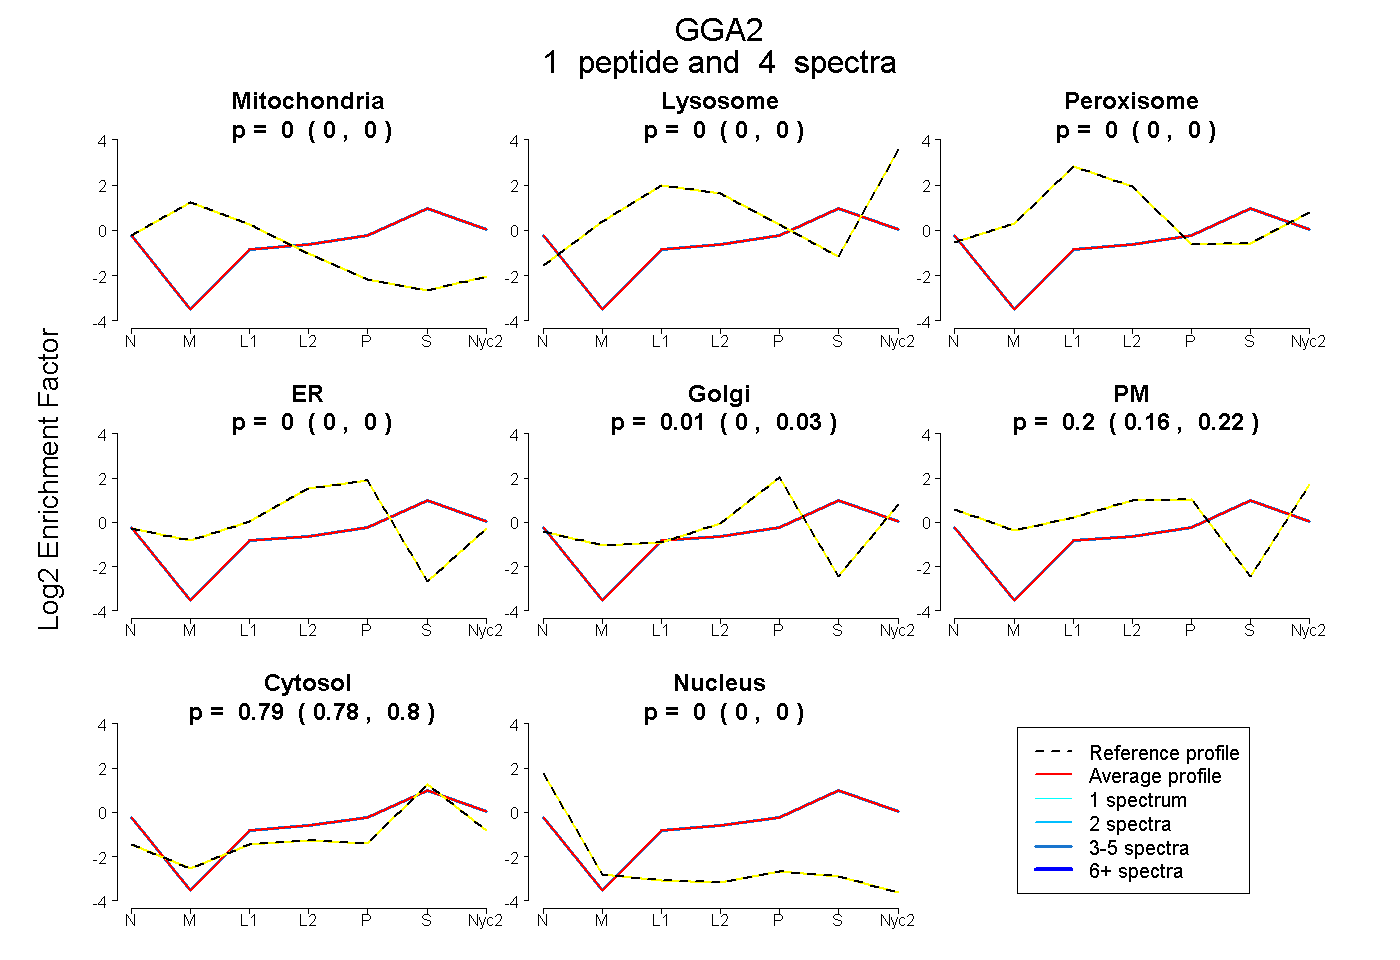
0.000 | 0.000
0.000 | 0.000
0.000 | 0.000
0.000 | 0.000
0.000 | 0.034
0.161 | 0.221
0.776 | 0.802
0.000 | 0.000
1peptide
spectra
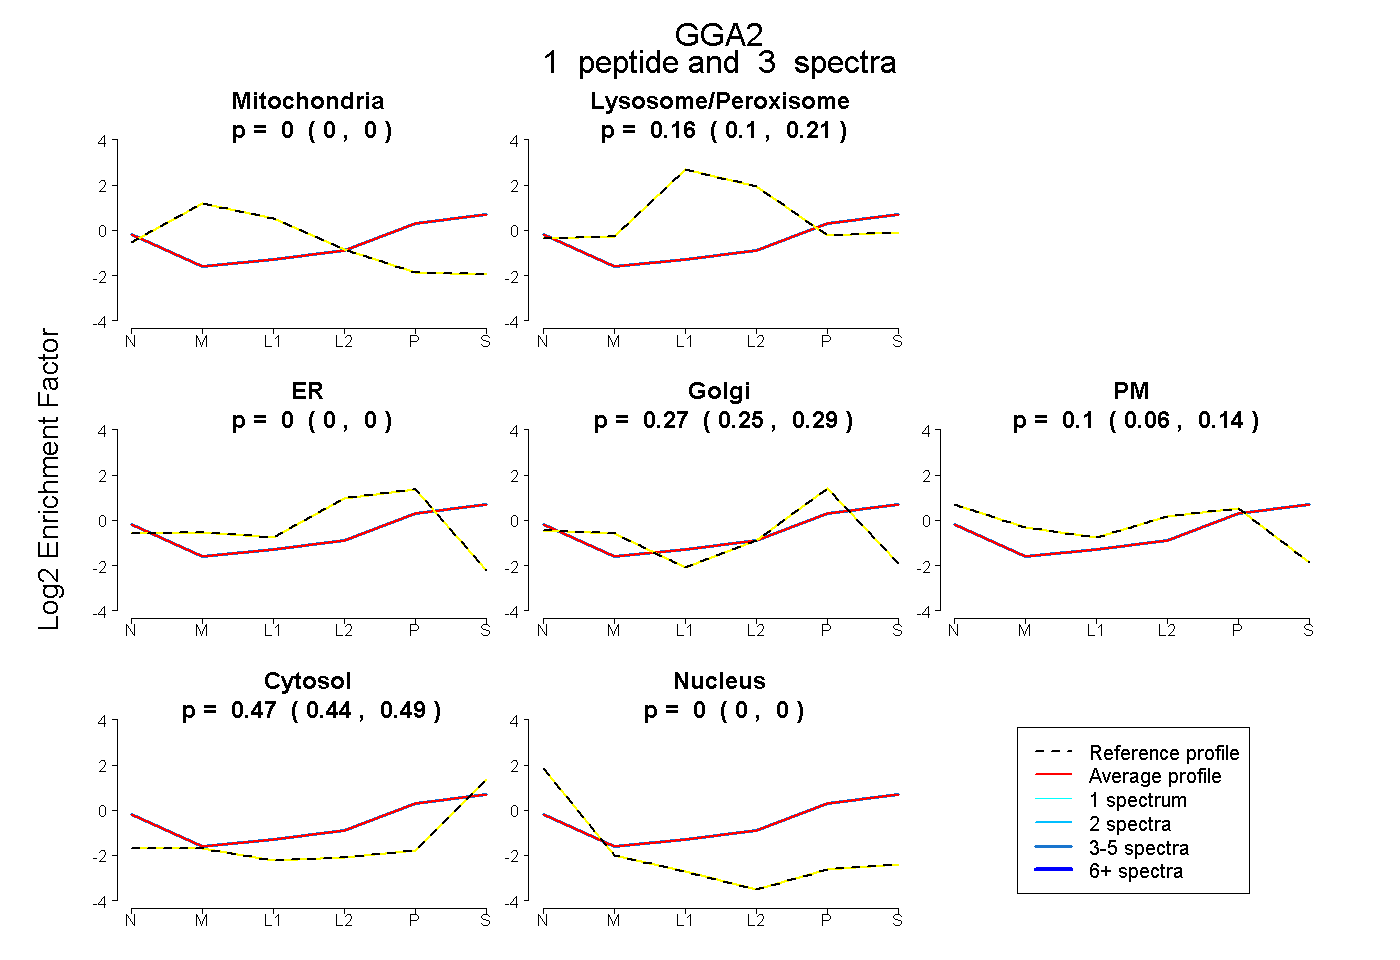
0.000 | 0.000
0.103 | 0.209
0.000 | 0.000
0.253 | 0.289
0.057 | 0.140
0.435 | 0.490
0.000 | 0.000
1peptide
spectra

NA | NA
NA | NA
1peptide
spectrum
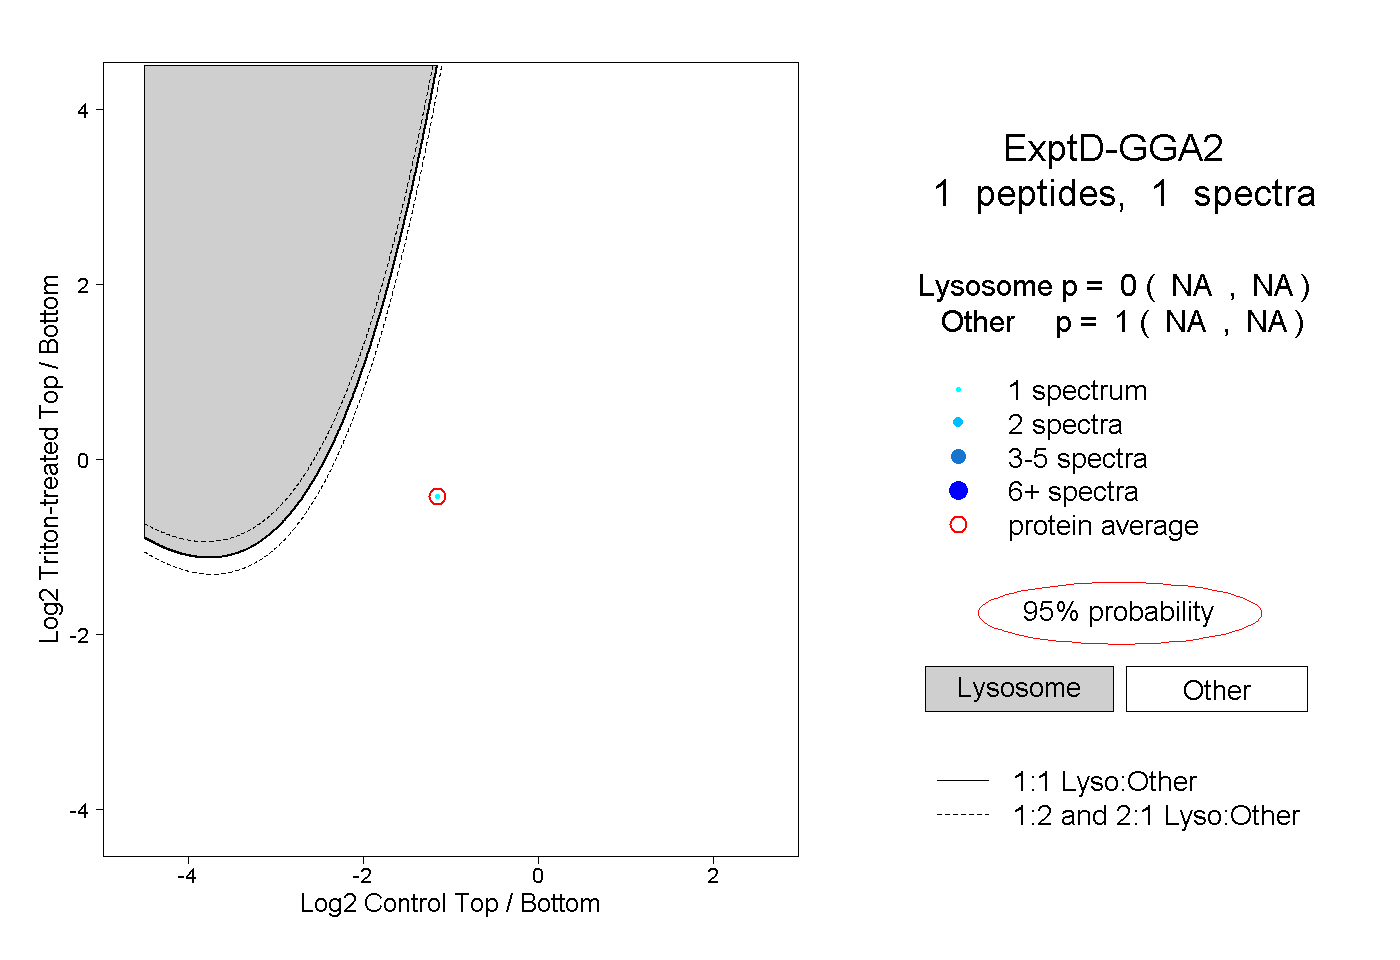
NA | NA
NA | NA