 7
7peptides
spectra
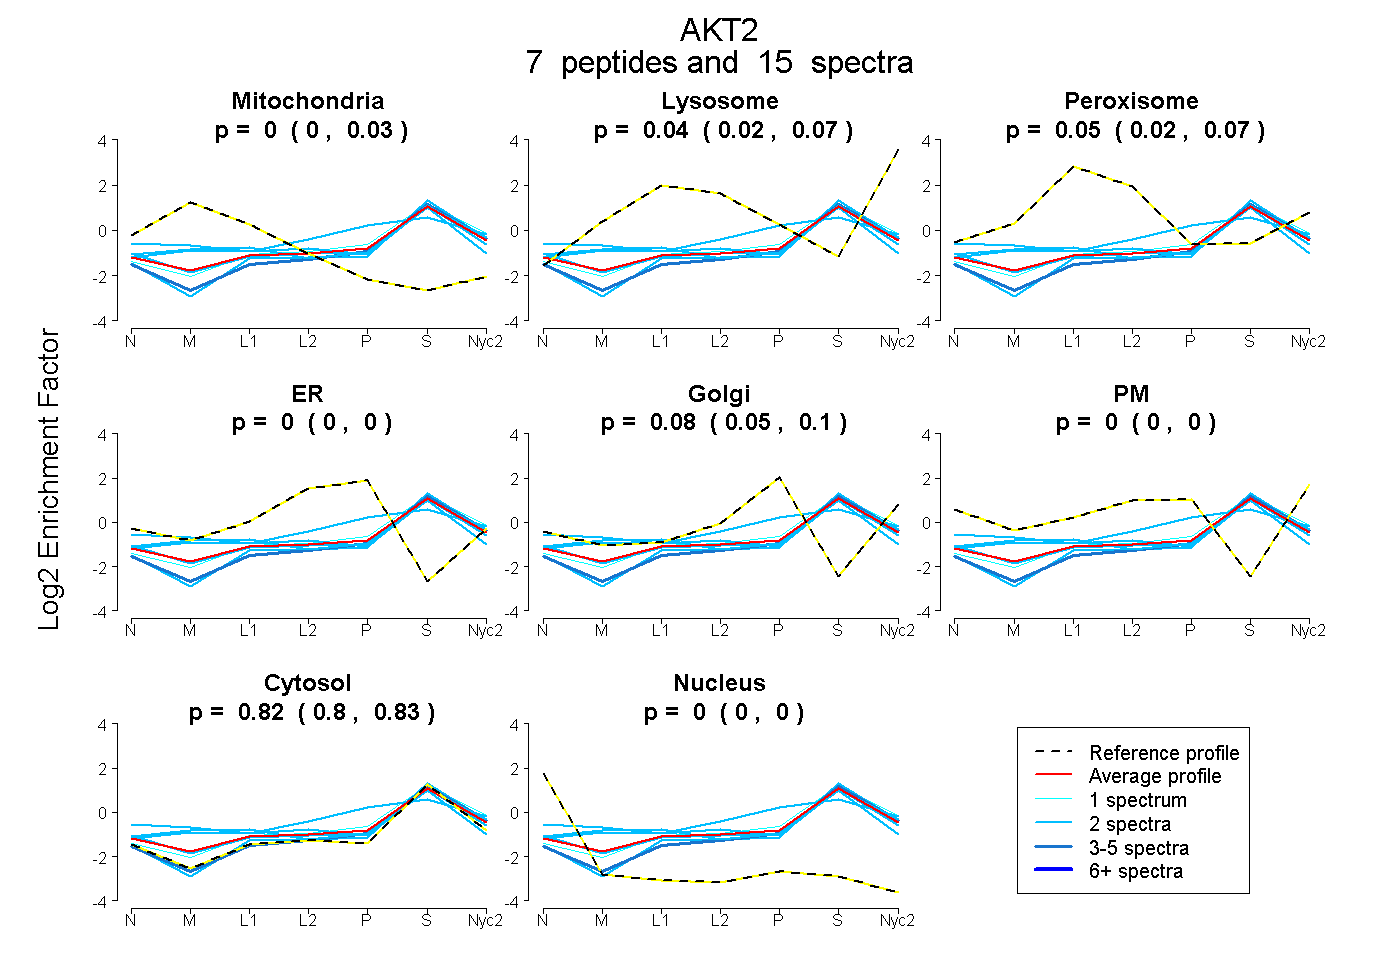
0.000 | 0.029
0.022 | 0.071
0.021 | 0.068
0.000 | 0.000
0.053 | 0.097
0.000 | 0.000
0.802 | 0.834
0.000 | 0.000
| Plot | Mito | Lyso | Perox | ER | Golgi | PM | Cytosol | Nucleus | |||||
| Expt A |
7 peptides |
15 spectra |
|
0.005 0.000 | 0.029 |
0.043 0.022 | 0.071 |
0.052 0.021 | 0.068 |
0.000 0.000 | 0.000 |
0.081 0.053 | 0.097 |
0.000 0.000 | 0.000 |
0.820 0.802 | 0.834 |
0.000 0.000 | 0.000 |
| 2 spectra, YAFQTHDR | 0.013 | 0.000 | 0.158 | 0.000 | 0.306 | 0.001 | 0.522 | 0.000 | ||
| 2 spectra, LPFYNQDHER | 0.182 | 0.000 | 0.095 | 0.000 | 0.000 | 0.000 | 0.723 | 0.000 | ||
| 2 spectra, LTDFGLCK | 0.017 | 0.000 | 0.053 | 0.000 | 0.006 | 0.067 | 0.857 | 0.000 | ||
| 2 spectra, VLQNTR | 0.110 | 0.136 | 0.026 | 0.000 | 0.000 | 0.000 | 0.728 | 0.000 | ||
| 1 spectrum, AIQMVANSLK | 0.000 | 0.118 | 0.000 | 0.000 | 0.048 | 0.000 | 0.834 | 0.000 | ||
| 2 spectra, GPGEDAMDYK | 0.000 | 0.036 | 0.000 | 0.000 | 0.000 | 0.000 | 0.964 | 0.000 | ||
| 4 spectra, HPFLTALK | 0.000 | 0.007 | 0.000 | 0.000 | 0.061 | 0.000 | 0.932 | 0.000 |
| Plot | Mito | Lyso or Perox | ER | Golgi | PM | Cytosol | Nucleus | ||||||
| Expt B |
2 peptides |
3 spectra |
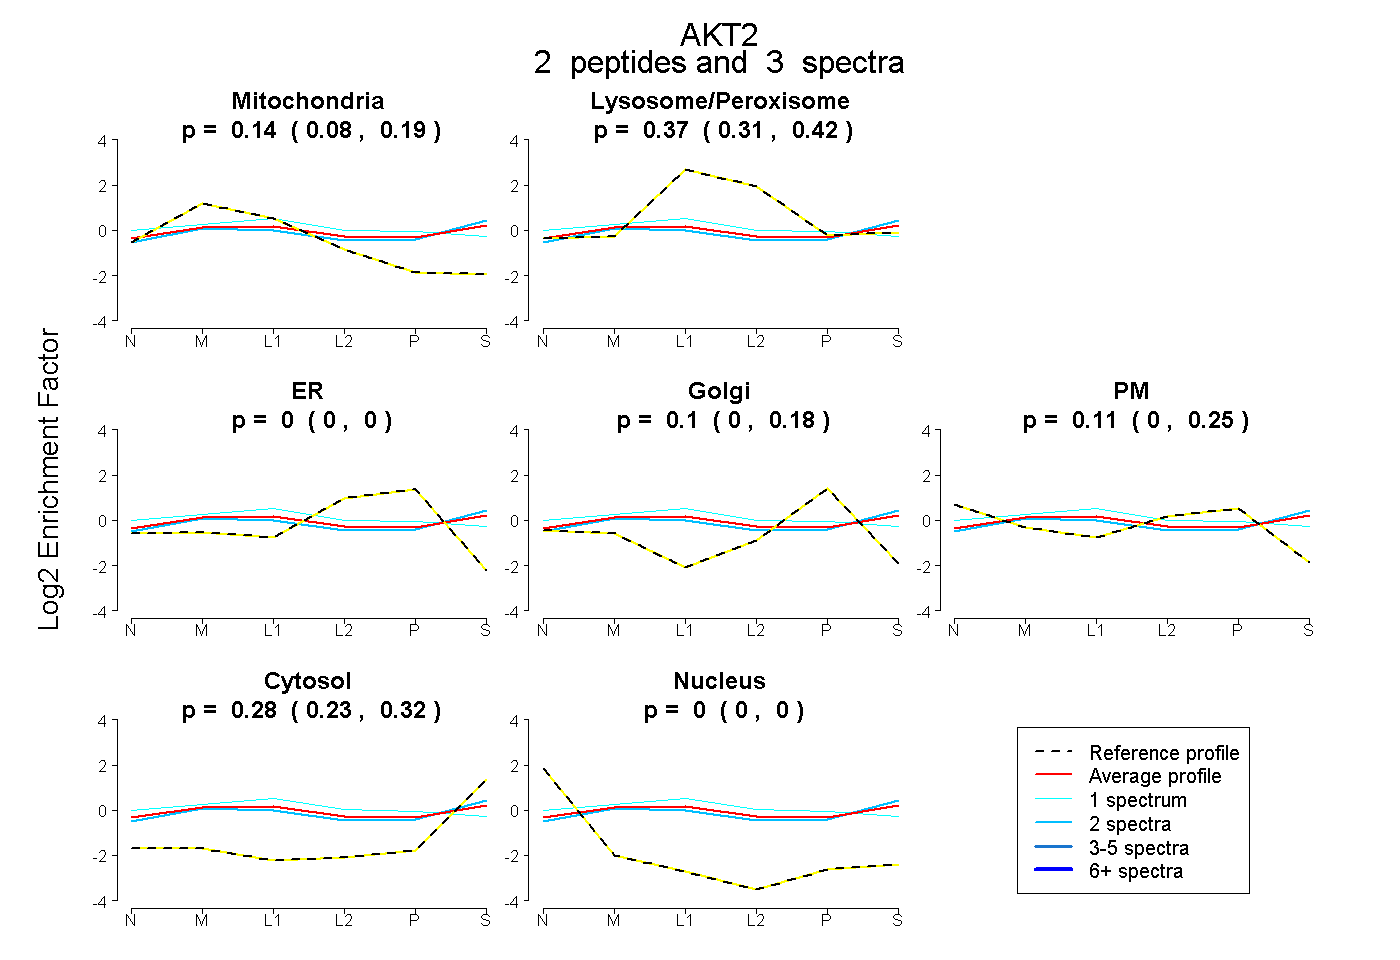 |
0.140 0.076 | 0.190 |
0.371 0.309 | 0.419 |
0.000 0.000 | 0.000 |
0.102 0.000 | 0.185 |
0.111 0.000 | 0.247 |
0.276 0.228 | 0.317 |
0.000 0.000 | 0.000 |
|||
| Plot | Lyso | Other | |||||||||||
| Expt C |
11 peptides |
18 spectra |
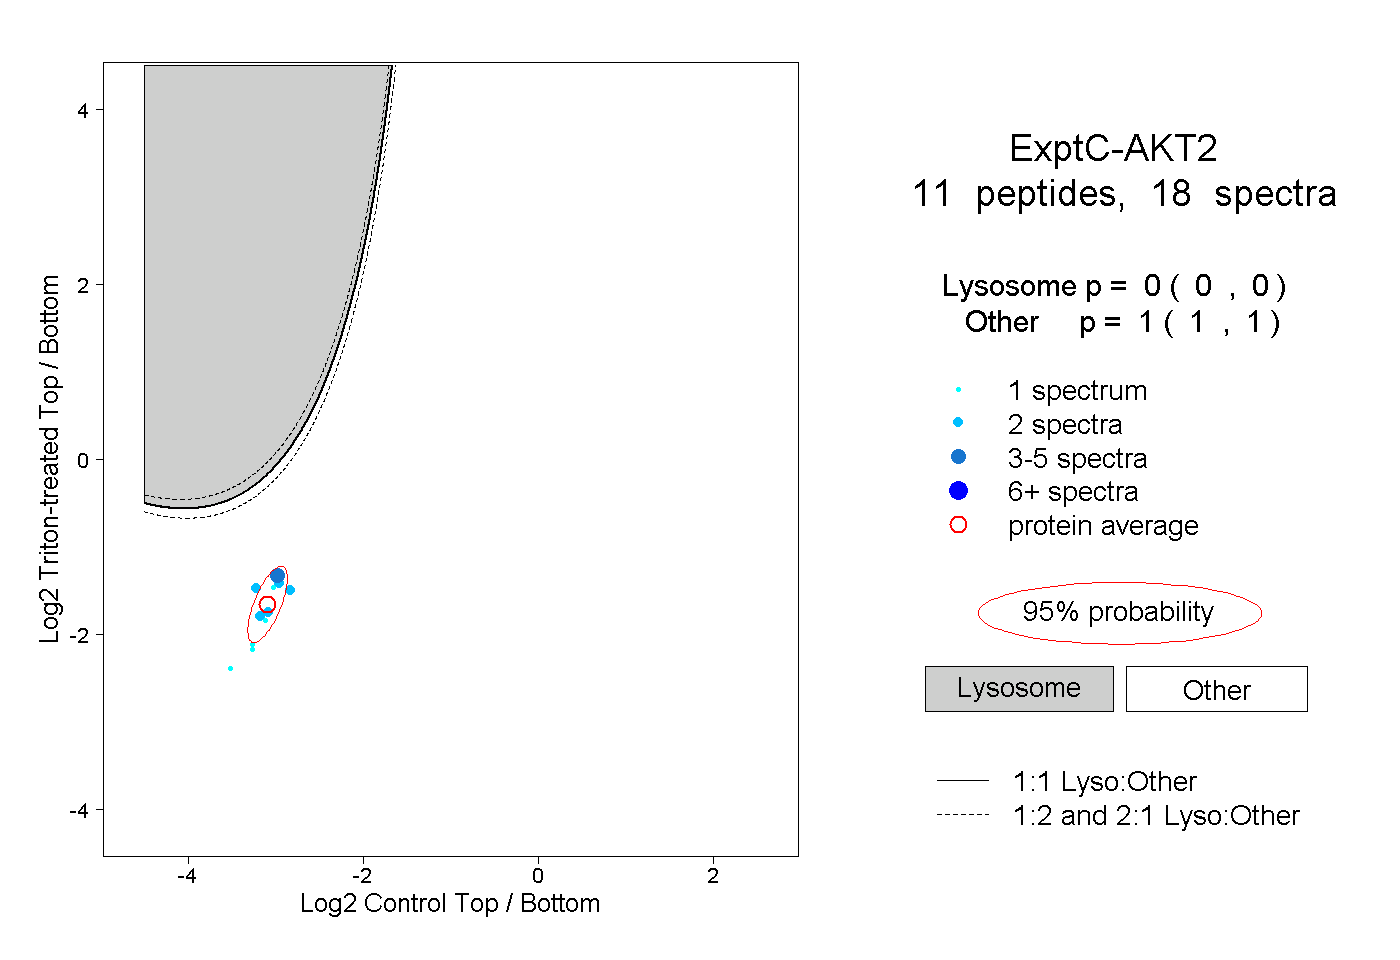 |
0.000 0.000 | 0.000 |
1.000 1.000 | 1.000 |