 7
7peptides
spectra
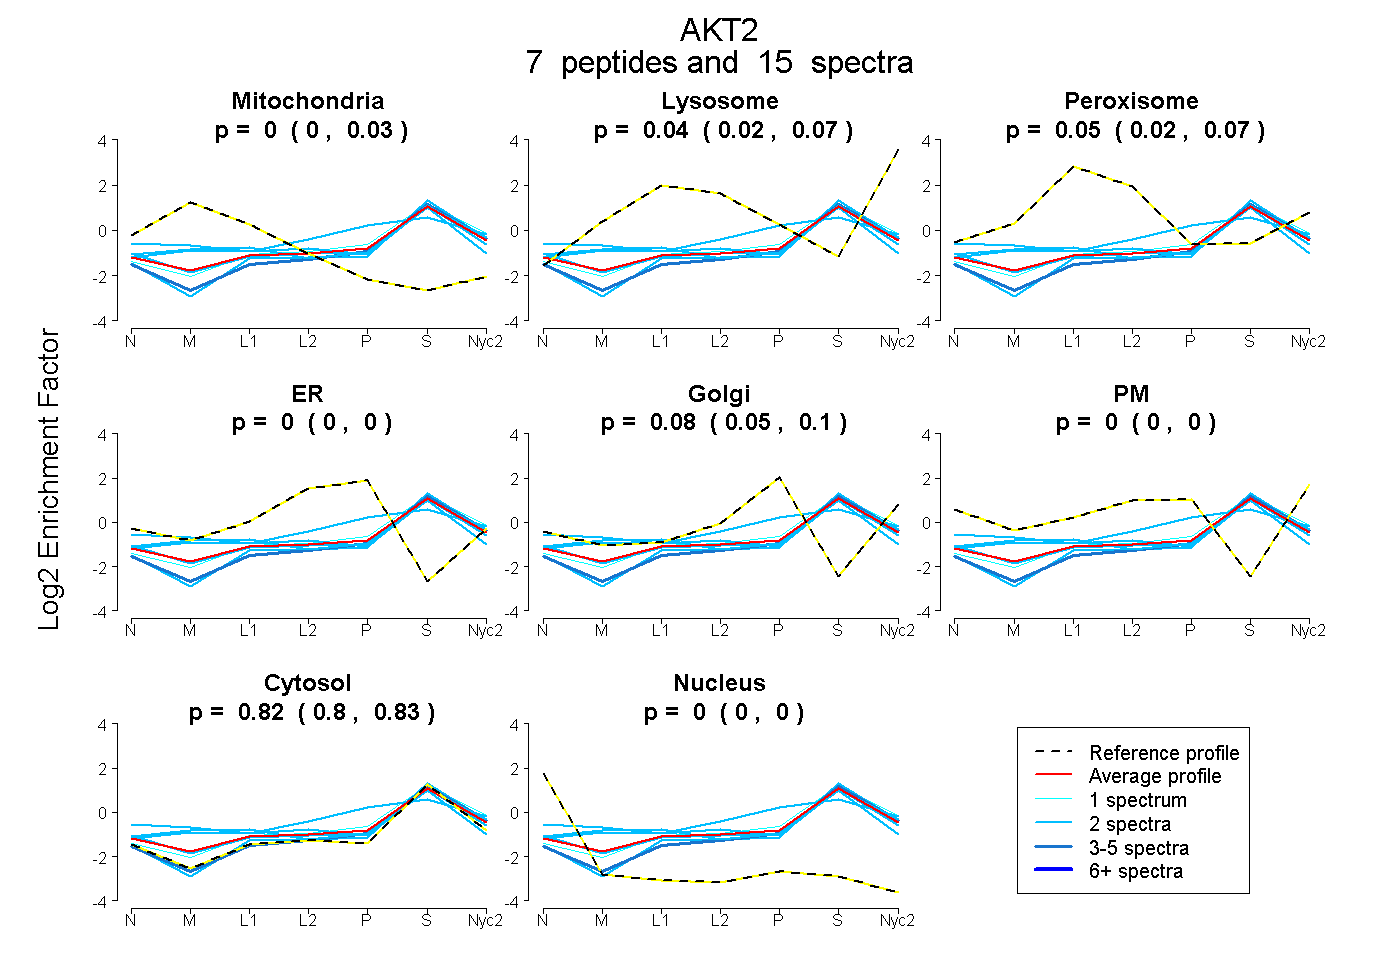
0.000 | 0.029
0.022 | 0.071
0.021 | 0.068
0.000 | 0.000
0.053 | 0.097
0.000 | 0.000
0.802 | 0.834
0.000 | 0.000
2peptides
spectra
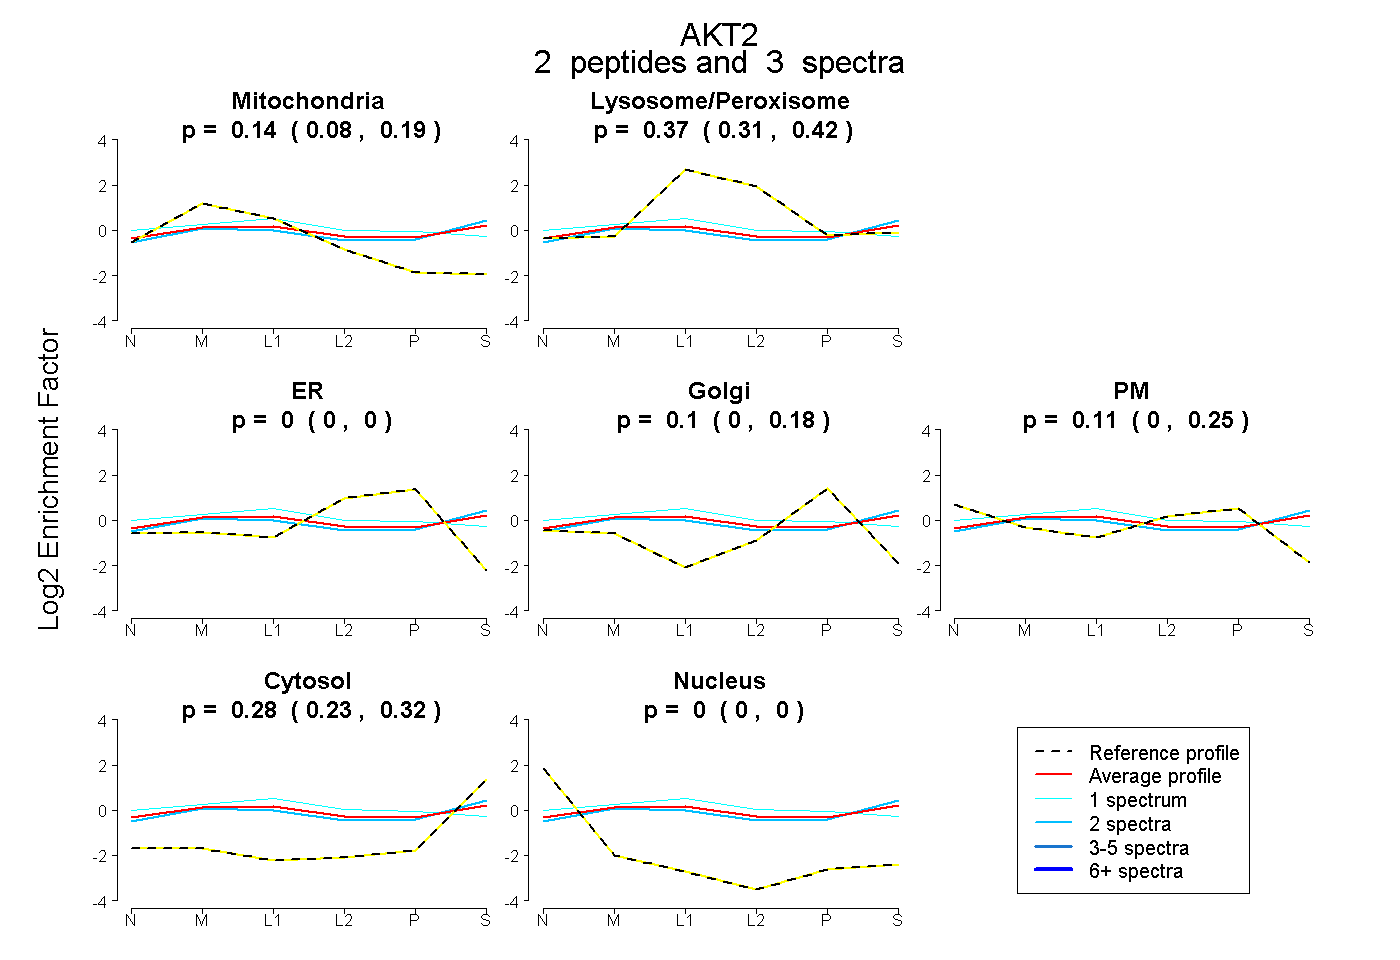
0.076 | 0.190
0.309 | 0.419
0.000 | 0.000
0.000 | 0.185
0.000 | 0.247
0.228 | 0.317
0.000 | 0.000
11peptides
spectra
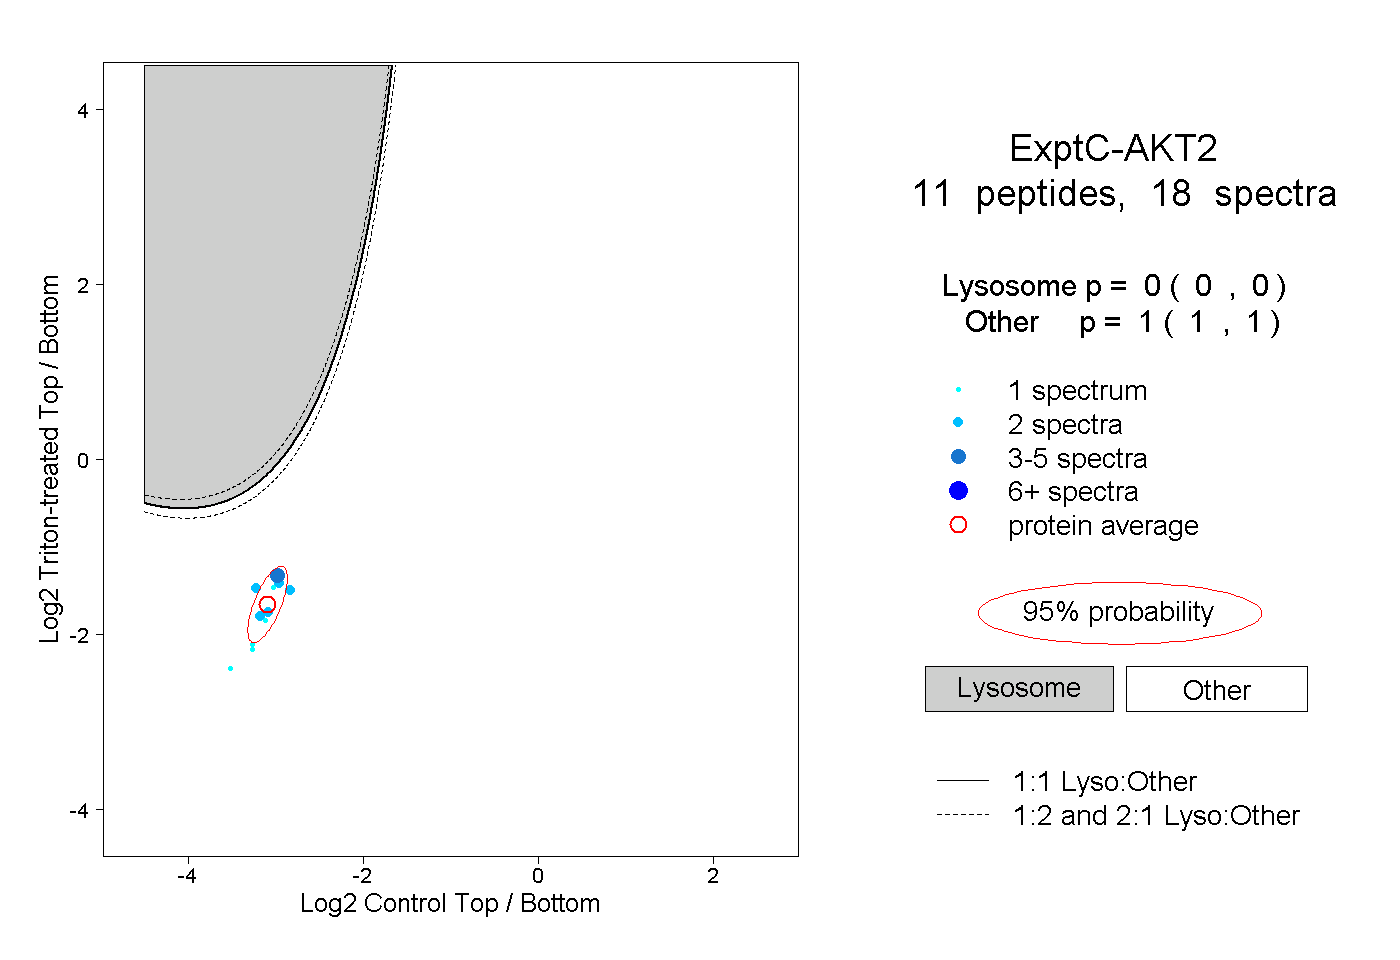
0.000 | 0.000
1.000 | 1.000