 3
3peptides
spectra
0.114 | 0.404
0.000 | 0.203
0.000 | 0.231
0.000 | 0.332
0.000 | 0.253
0.020 | 0.594
0.000 | 0.069
0.000 | 0.131
1peptide
spectra
NA | NA
NA | NA
| Plot | Mito | Lyso | Perox | ER | Golgi | PM | Cytosol | Nucleus | |||||
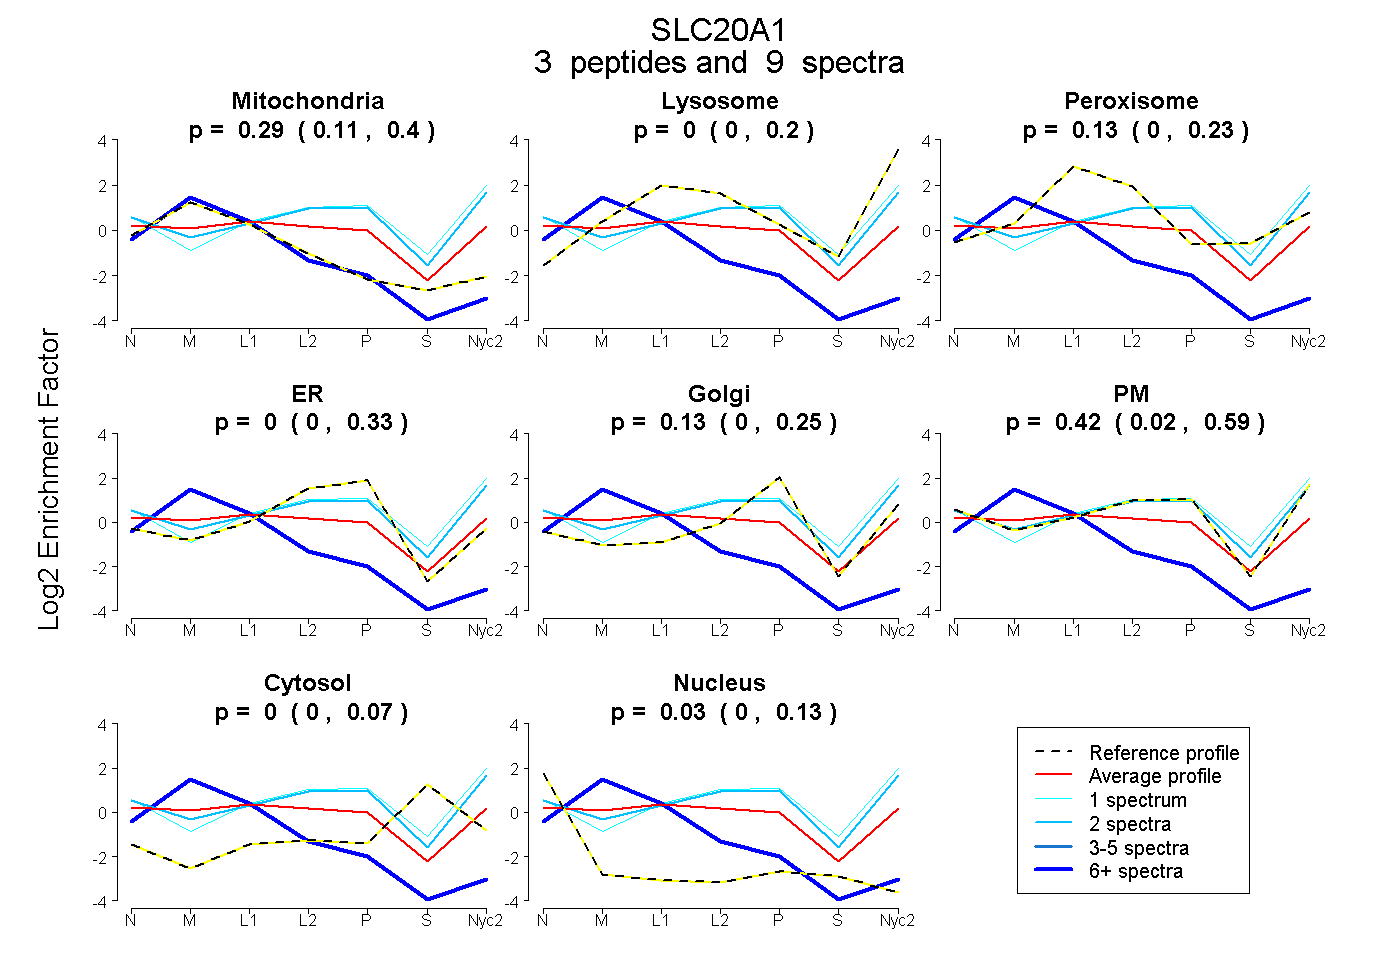
| Expt A |
3 peptides |
9 spectra |
|
0.293 0.114 | 0.404 |
0.000 0.000 | 0.203 |
0.128 0.000 | 0.231 |
0.000 0.000 | 0.332 |
0.129 0.000 | 0.253 |
0.421 0.020 | 0.594 |
0.000 0.000 | 0.069 |
0.029 0.000 | 0.131 |
||
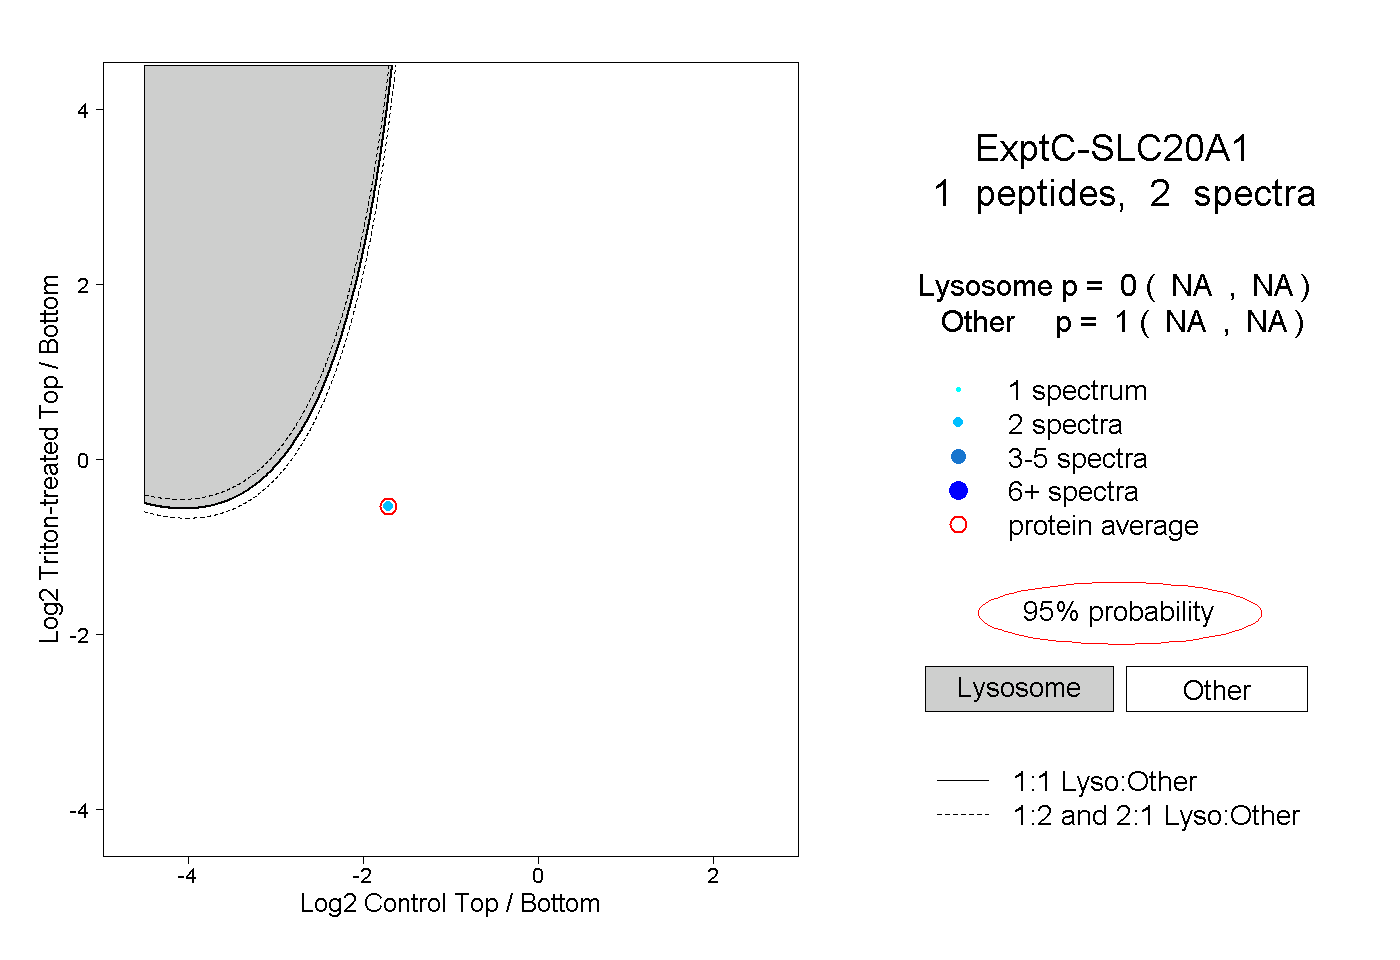
| Plot | Lyso | Other | |||||||||||
| Expt C |
1 peptide |
2 spectra |
|
0.000 NA | NA |
1.000 NA | NA |