 1
1peptide
spectra
0.027 | 0.097
0.000 | 0.000
0.020 | 0.201
0.000 | 0.020
0.000 | 0.152
0.156 | 0.376
0.363 | 0.458
0.013 | 0.077
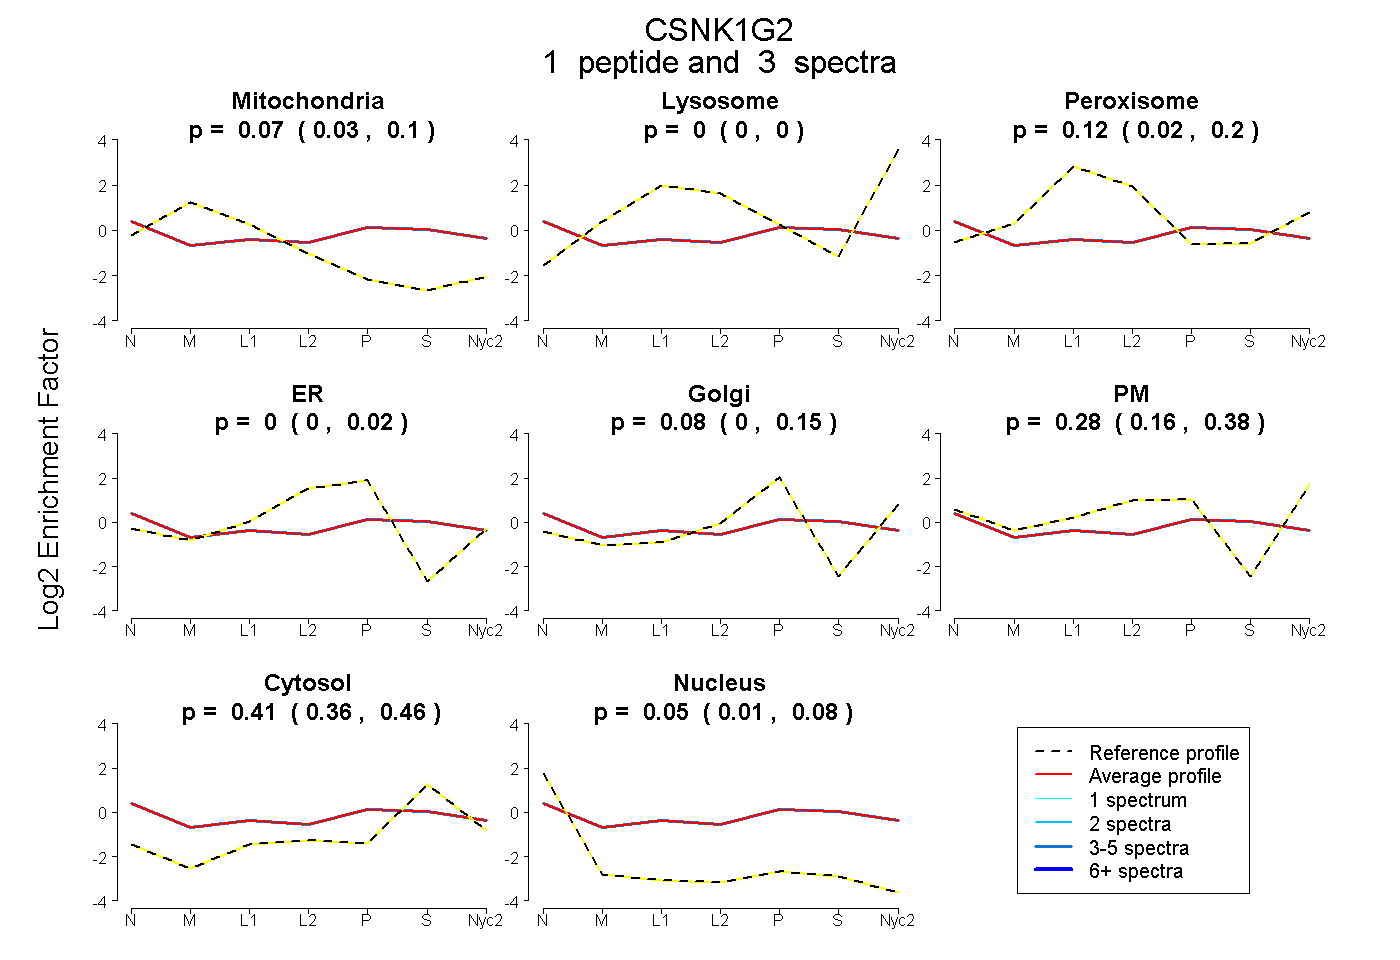
| Plot | Mito | Lyso | Perox | ER | Golgi | PM | Cytosol | Nucleus | |||||
| Expt A |
1 peptide |
3 spectra |
|
0.065 0.027 | 0.097 |
0.000 0.000 | 0.000 |
0.117 0.020 | 0.201 |
0.000 0.000 | 0.020 |
0.077 0.000 | 0.152 |
0.279 0.156 | 0.376 |
0.415 0.363 | 0.458 |
0.047 0.013 | 0.077 |