17
17peptides
spectra
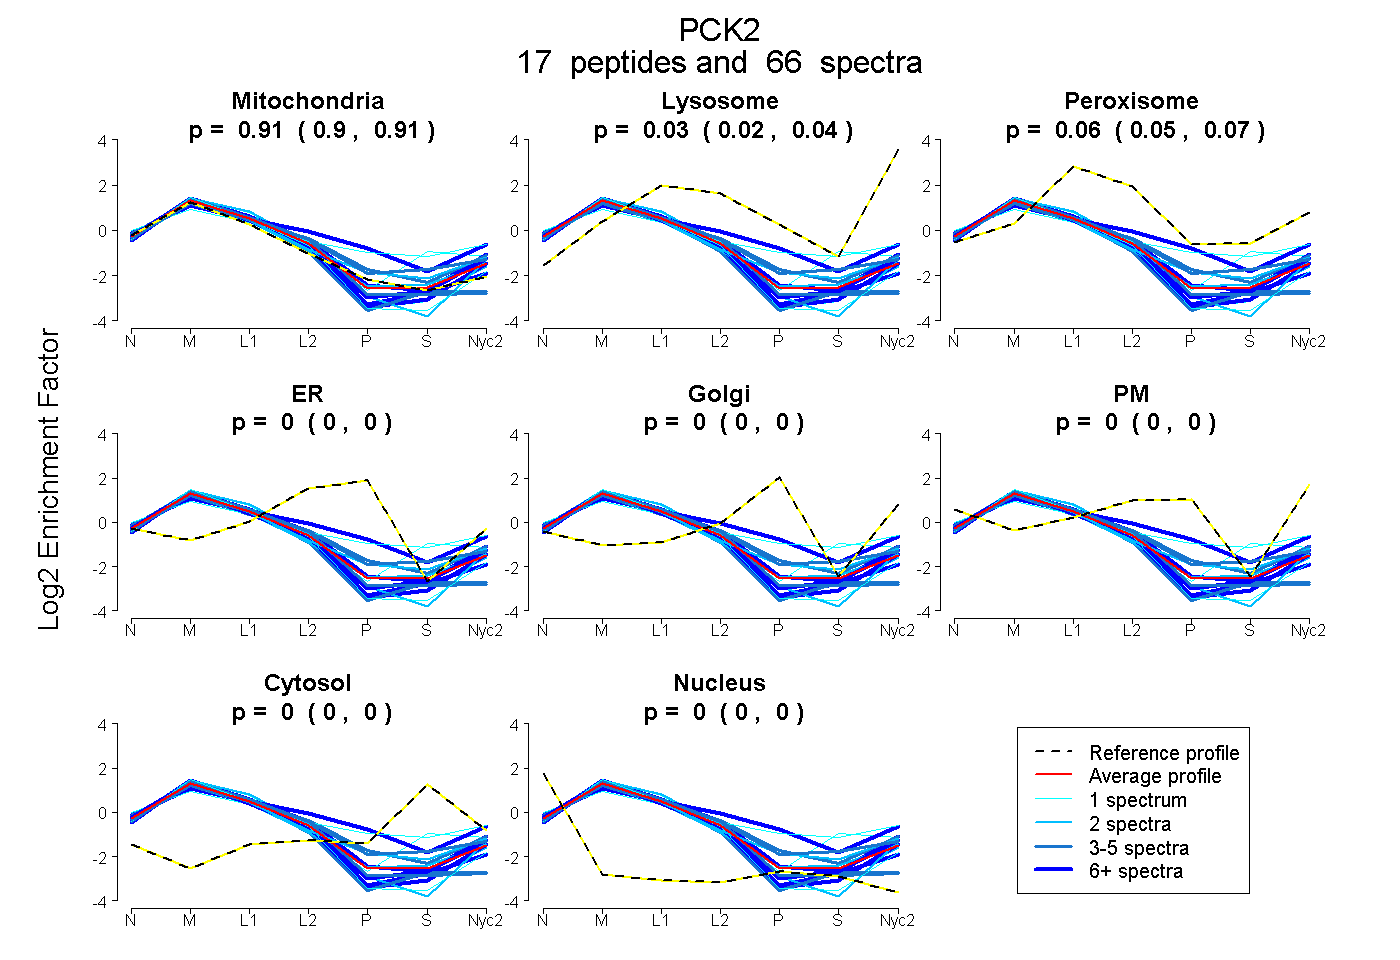
0.901 | 0.909
0.021 | 0.040
0.053 | 0.072
0.000 | 0.000
0.000 | 0.000
0.000 | 0.000
0.000 | 0.000
0.000 | 0.000
9peptides
spectra
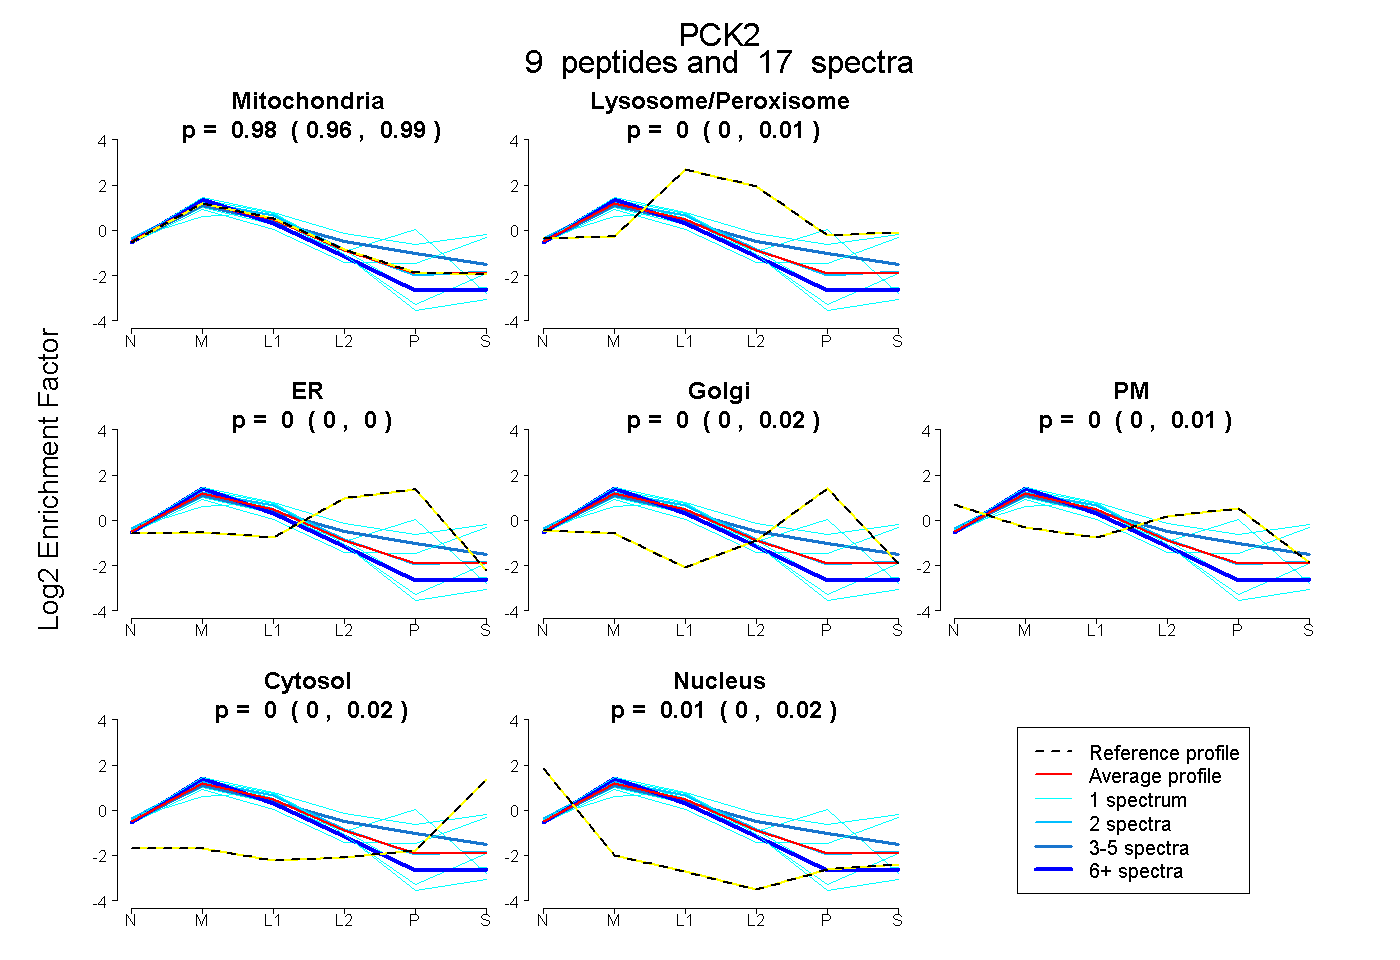
0.960 | 0.989
0.000 | 0.005
0.000 | 0.000
0.000 | 0.015
0.000 | 0.009
0.000 | 0.022
0.000 | 0.020