 17
17peptides
spectra
0.901 | 0.909
0.021 | 0.040
0.053 | 0.072
0.000 | 0.000
0.000 | 0.000
0.000 | 0.000
0.000 | 0.000
0.000 | 0.000
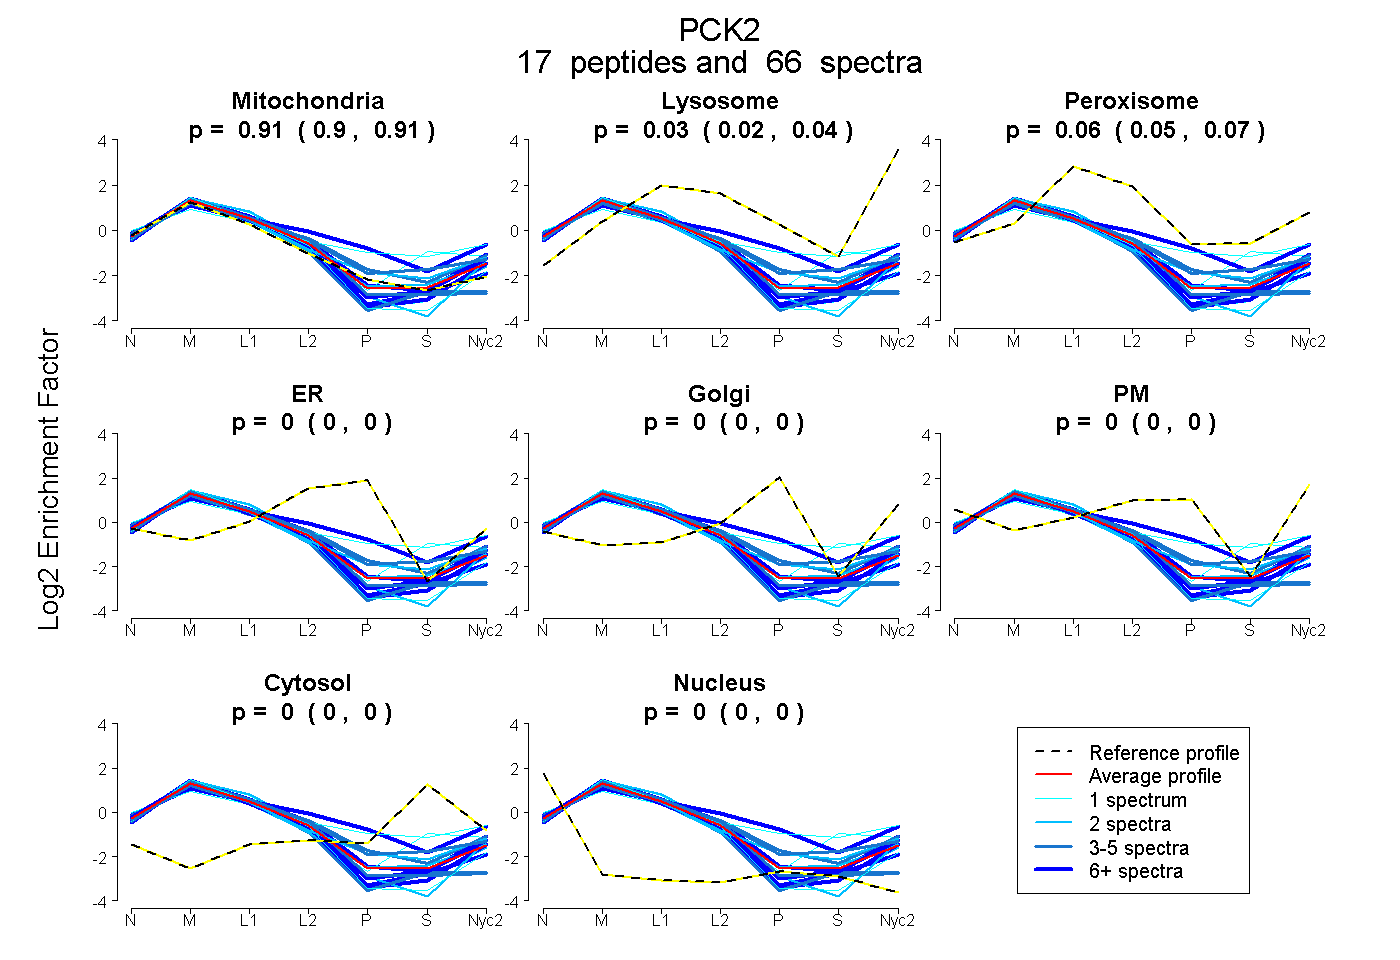
| Plot | Mito | Lyso | Perox | ER | Golgi | PM | Cytosol | Nucleus | |||||
| Expt A |
17 peptides |
66 spectra |
|
0.906 0.901 | 0.909 |
0.031 0.021 | 0.040 |
0.063 0.053 | 0.072 |
0.000 0.000 | 0.000 |
0.000 0.000 | 0.000 |
0.000 0.000 | 0.000 |
0.000 0.000 | 0.000 |
0.000 0.000 | 0.000 |
| 2 spectra, WPCNPEK | 0.849 | 0.129 | 0.000 | 0.000 | 0.000 | 0.000 | 0.021 | 0.000 | ||
| 5 spectra, LGGEDSAR | 0.784 | 0.067 | 0.058 | 0.000 | 0.000 | 0.091 | 0.000 | 0.000 | ||
| 5 spectra, IGVQLTDSPYVVASMR | 0.986 | 0.000 | 0.000 | 0.000 | 0.000 | 0.000 | 0.000 | 0.014 | ||
| 7 spectra, FPGCMQGR | 1.000 | 0.000 | 0.000 | 0.000 | 0.000 | 0.000 | 0.000 | 0.000 | ||
| 1 spectrum, FCVPAR | 0.691 | 0.000 | 0.145 | 0.000 | 0.000 | 0.000 | 0.164 | 0.000 | ||
| 10 spectra, DFWEQEVR | 0.864 | 0.120 | 0.015 | 0.000 | 0.000 | 0.000 | 0.000 | 0.000 | ||
| 7 spectra, HGVFVGSAMR | 0.561 | 0.034 | 0.190 | 0.000 | 0.113 | 0.102 | 0.000 | 0.000 | ||
| 1 spectrum, AIDTSQLFSIPK | 0.978 | 0.022 | 0.000 | 0.000 | 0.000 | 0.000 | 0.000 | 0.000 | ||
| 1 spectrum, VLSGDLSQLPAGVR | 1.000 | 0.000 | 0.000 | 0.000 | 0.000 | 0.000 | 0.000 | 0.000 | ||
| 2 spectra, SYLTEQVNQDLPK | 0.922 | 0.060 | 0.009 | 0.000 | 0.000 | 0.000 | 0.010 | 0.000 | ||
| 6 spectra, FLWPGFGENAR | 0.989 | 0.011 | 0.000 | 0.000 | 0.000 | 0.000 | 0.000 | 0.000 | ||
| 7 spectra, TVIVTSSQR | 0.934 | 0.066 | 0.000 | 0.000 | 0.000 | 0.000 | 0.000 | 0.000 | ||
| 3 spectra, YENCWLAR | 0.746 | 0.019 | 0.179 | 0.000 | 0.000 | 0.000 | 0.056 | 0.000 | ||
| 4 spectra, VLDWICR | 1.000 | 0.000 | 0.000 | 0.000 | 0.000 | 0.000 | 0.000 | 0.000 | ||
| 2 spectra, EGALDLSGLR | 0.937 | 0.000 | 0.063 | 0.000 | 0.000 | 0.000 | 0.000 | 0.000 | ||
| 1 spectrum, TLIGHVPEQR | 0.521 | 0.033 | 0.152 | 0.000 | 0.000 | 0.157 | 0.137 | 0.000 | ||
| 2 spectra, GVPLVYEAFSWR | 0.953 | 0.047 | 0.000 | 0.000 | 0.000 | 0.000 | 0.000 | 0.000 |
| Plot | Mito | Lyso or Perox | ER | Golgi | PM | Cytosol | Nucleus | ||||||
| Expt B |
9 peptides |
17 spectra |
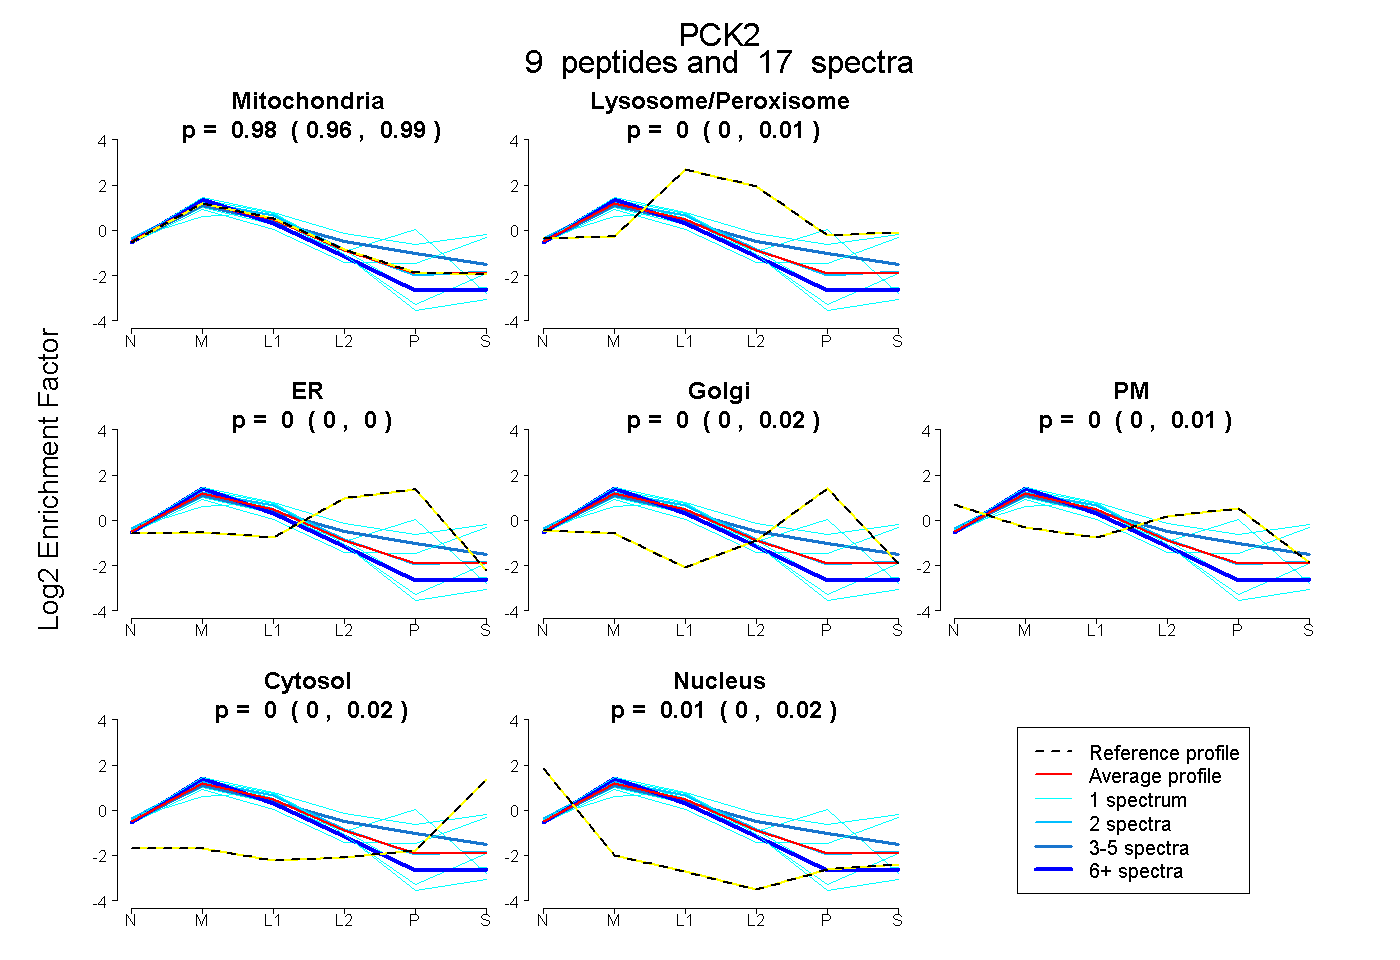 |
0.984 0.960 | 0.989 |
0.000 0.000 | 0.005 |
0.000 0.000 | 0.000 |
0.000 0.000 | 0.015 |
0.000 0.000 | 0.009 |
0.004 0.000 | 0.022 |
0.012 0.000 | 0.020 |
|||
| Plot | Lyso | Other | |||||||||||
| Expt C |
26 peptides |
177 spectra |
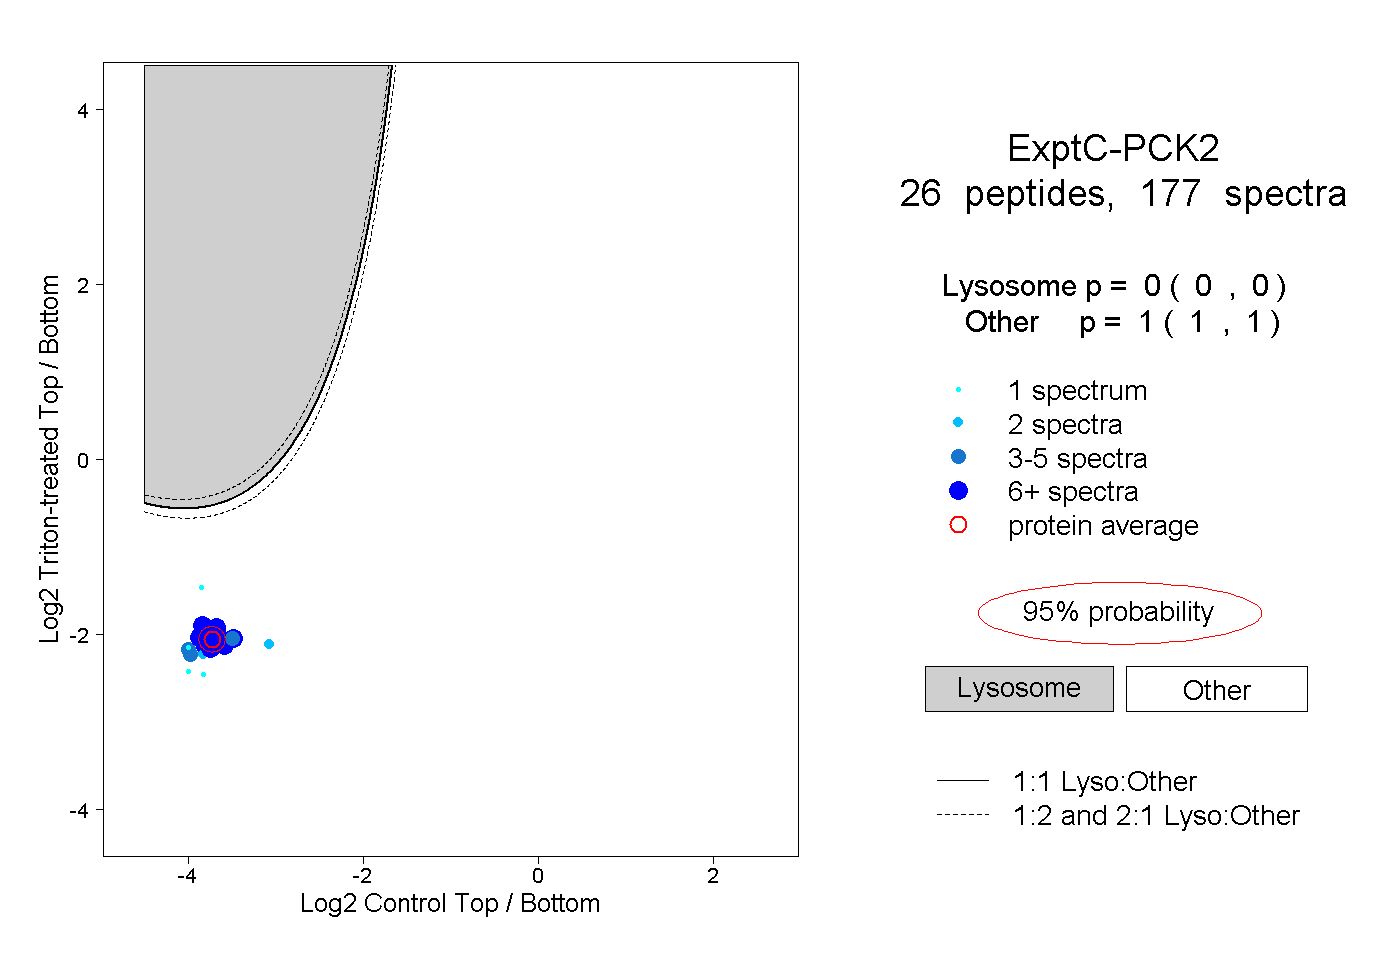 |
0.000 0.000 | 0.000 |
1.000 1.000 | 1.000 |
||||||||
| Plot | Lyso | Other | |||||||||||
| Expt D |
9 peptides |
14 spectra |
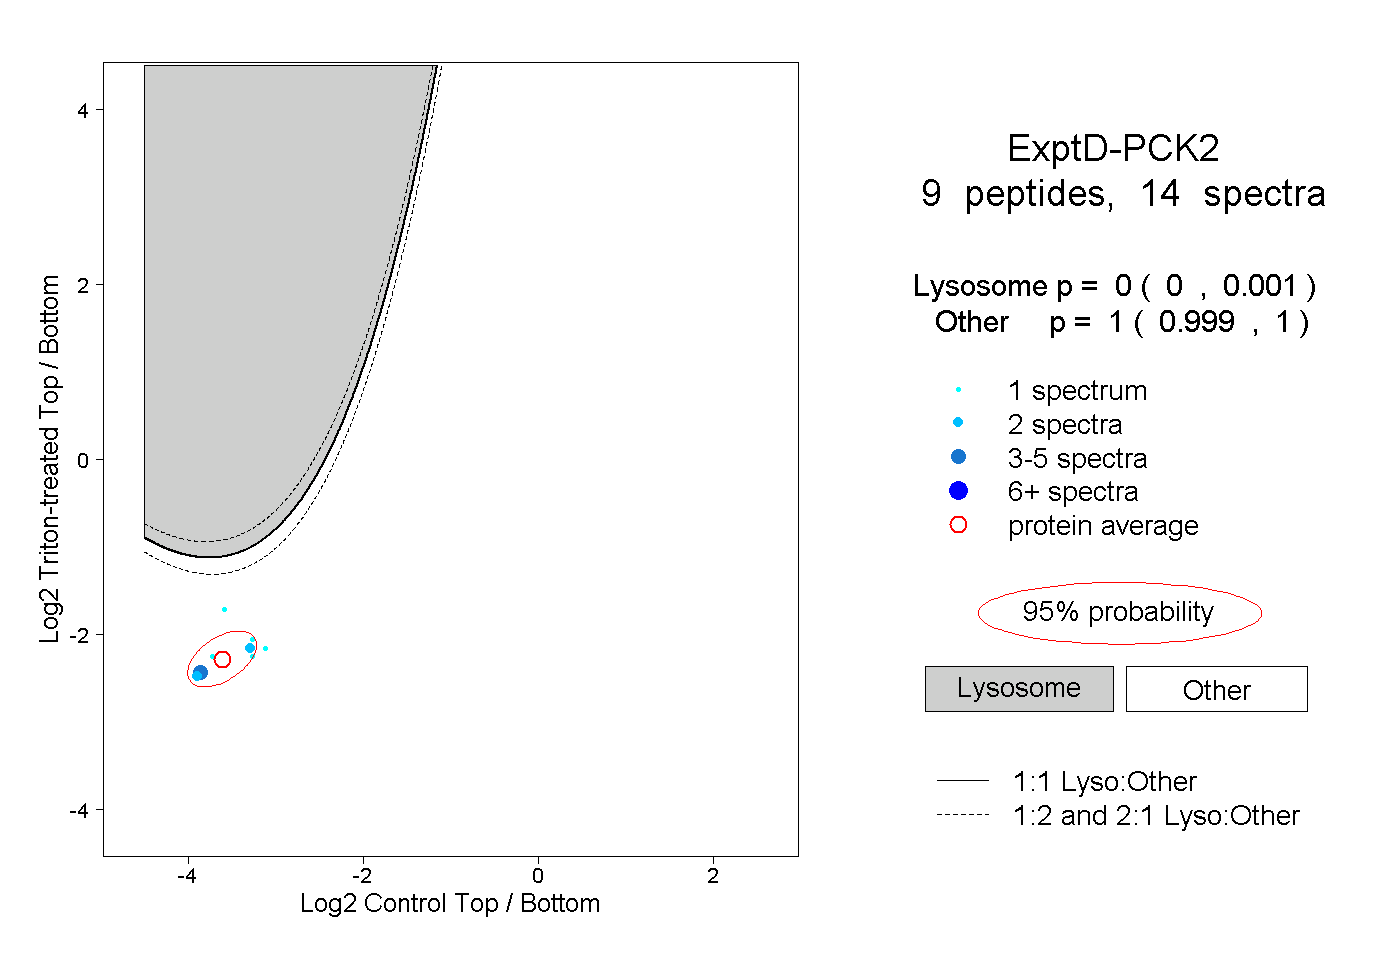 |
0.000 0.000 | 0.001 |
1.000 0.999 | 1.000 |