12
12peptides
spectra
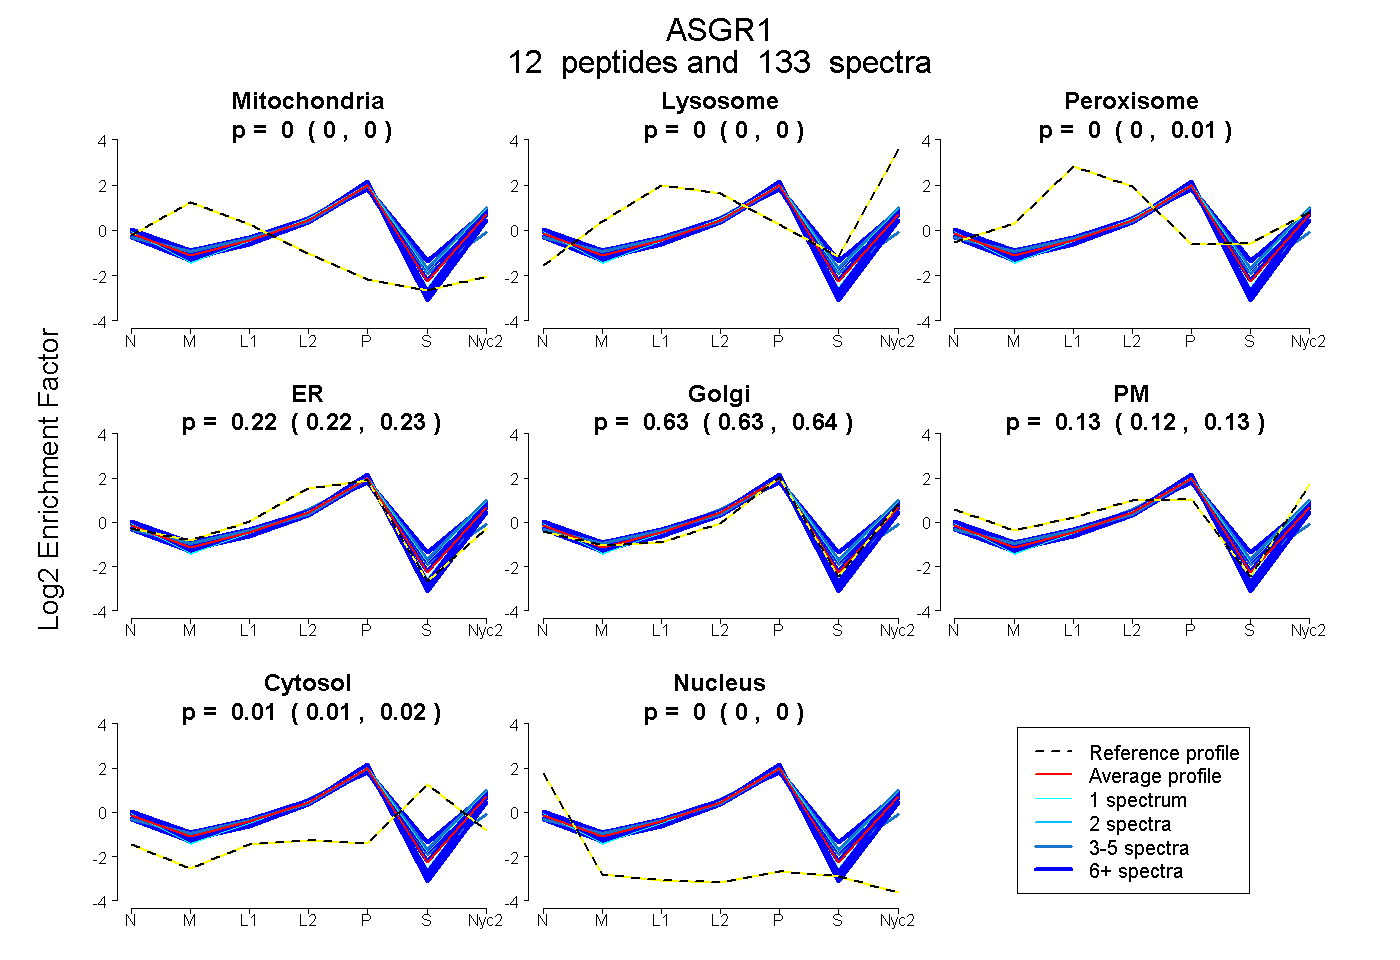
0.000 | 0.000
0.000 | 0.000
0.000 | 0.006
0.216 | 0.230
0.626 | 0.638
0.120 | 0.132
0.012 | 0.018
0.000 | 0.000
9peptides
spectra
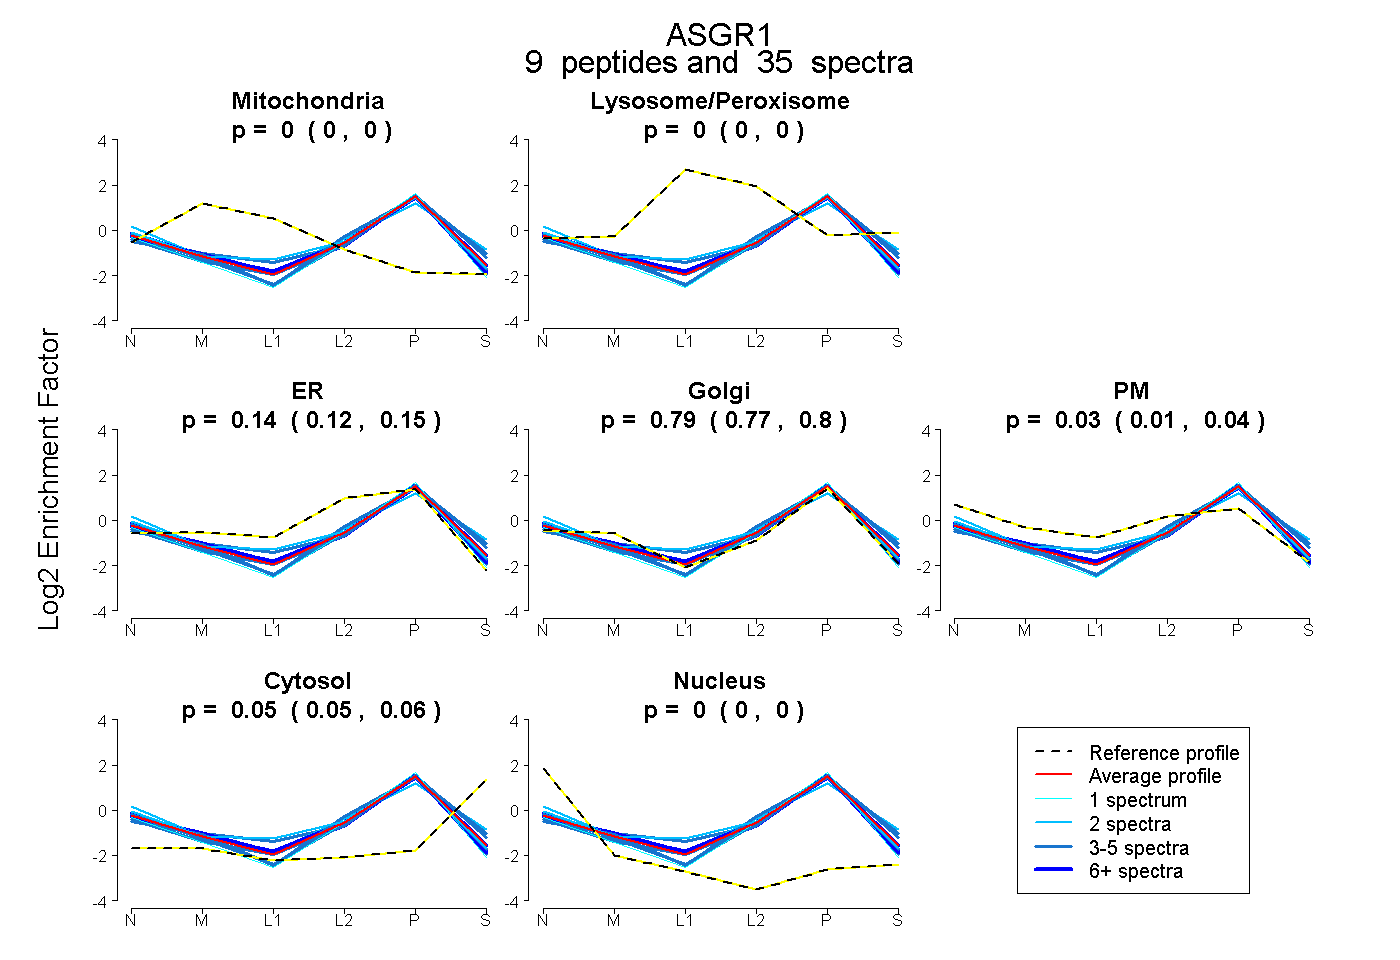
0.000 | 0.000
0.000 | 0.000
0.122 | 0.147
0.769 | 0.802
0.011 | 0.038
0.045 | 0.058
0.000 | 0.000
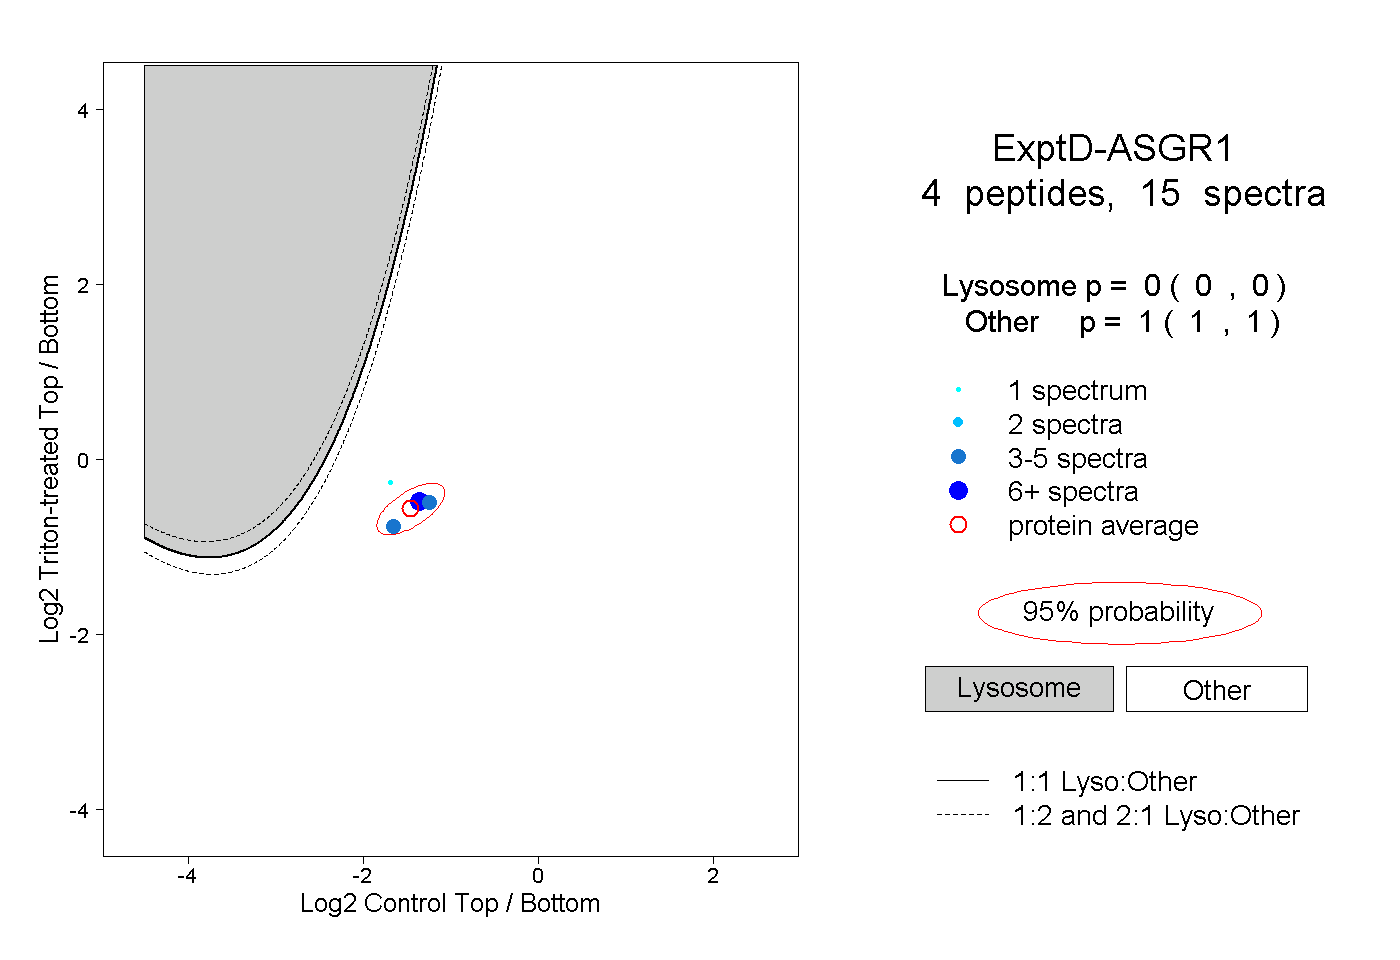
9peptides
spectra
0.000 | 0.000
1.000 | 1.000