15
15peptides
spectra
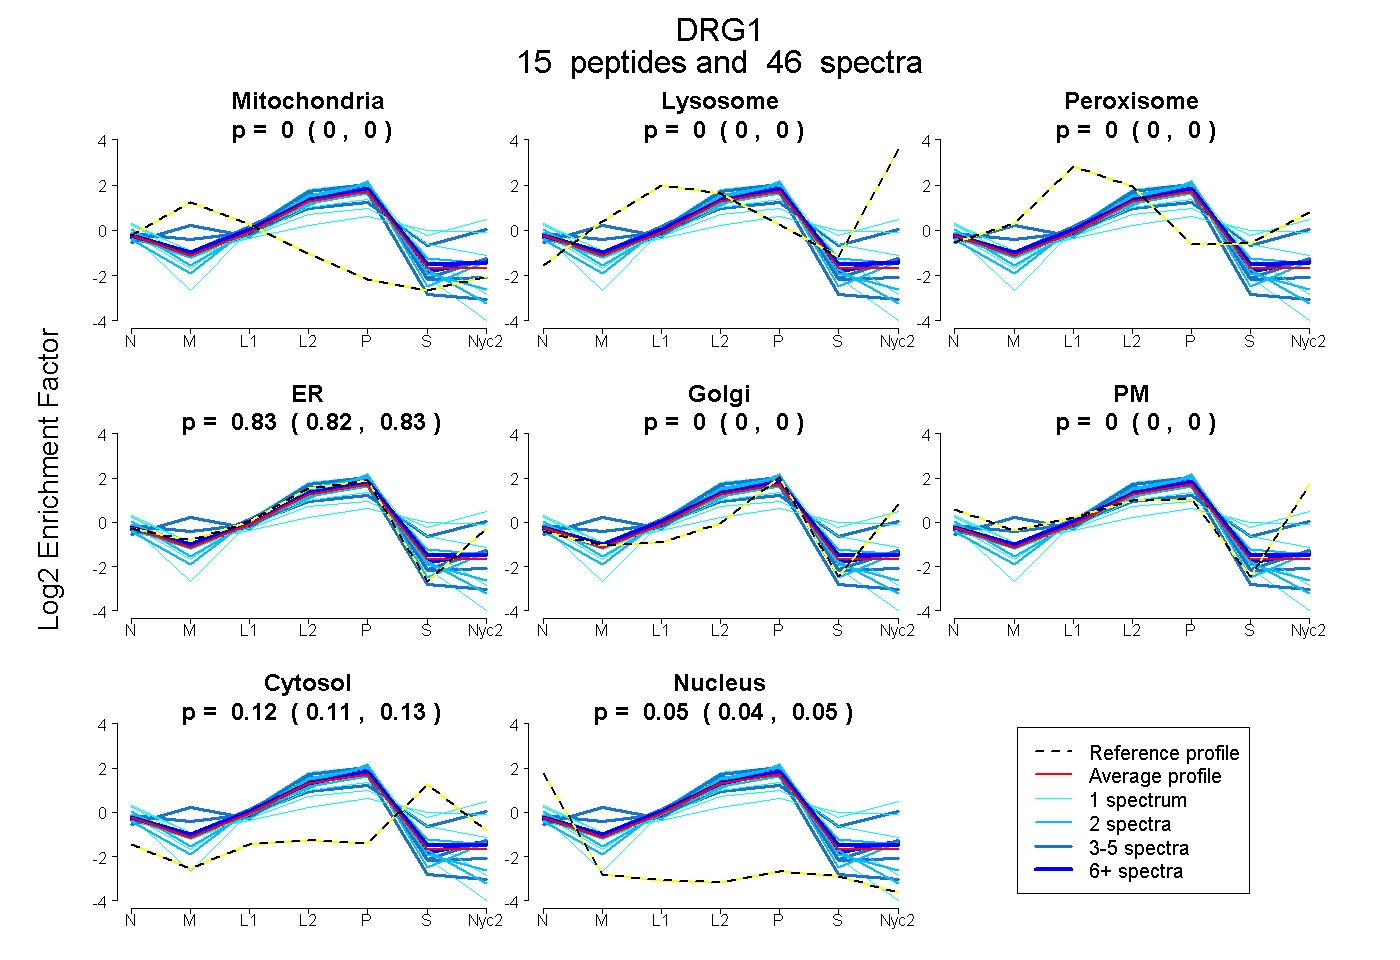
0.000 | 0.000
0.000 | 0.000
0.000 | 0.000
0.823 | 0.835
0.000 | 0.000
0.000 | 0.000
0.112 | 0.131
0.040 | 0.055
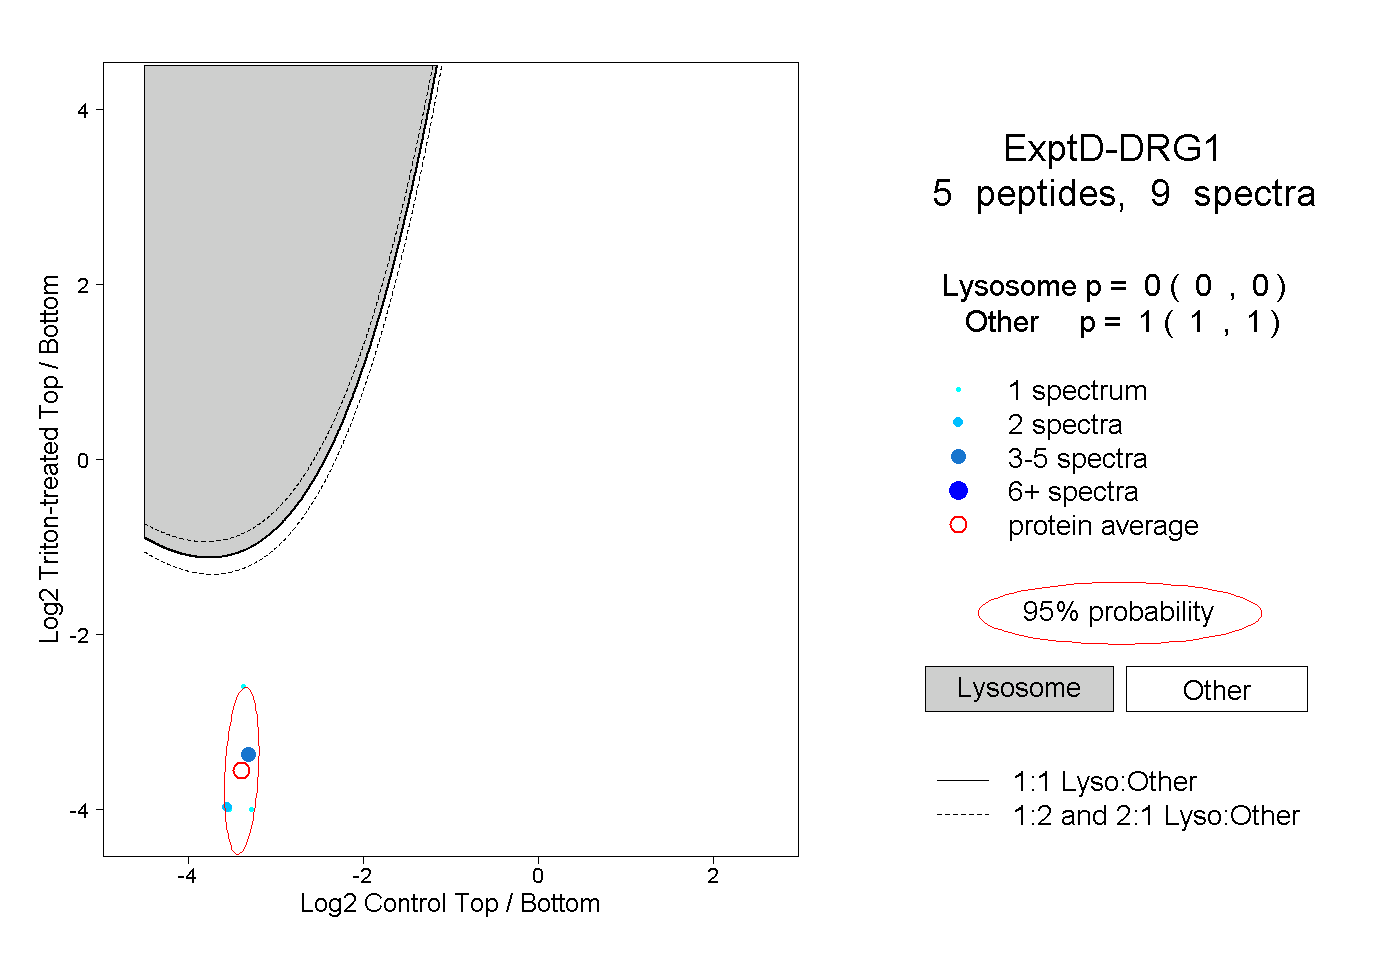
9peptides
spectra
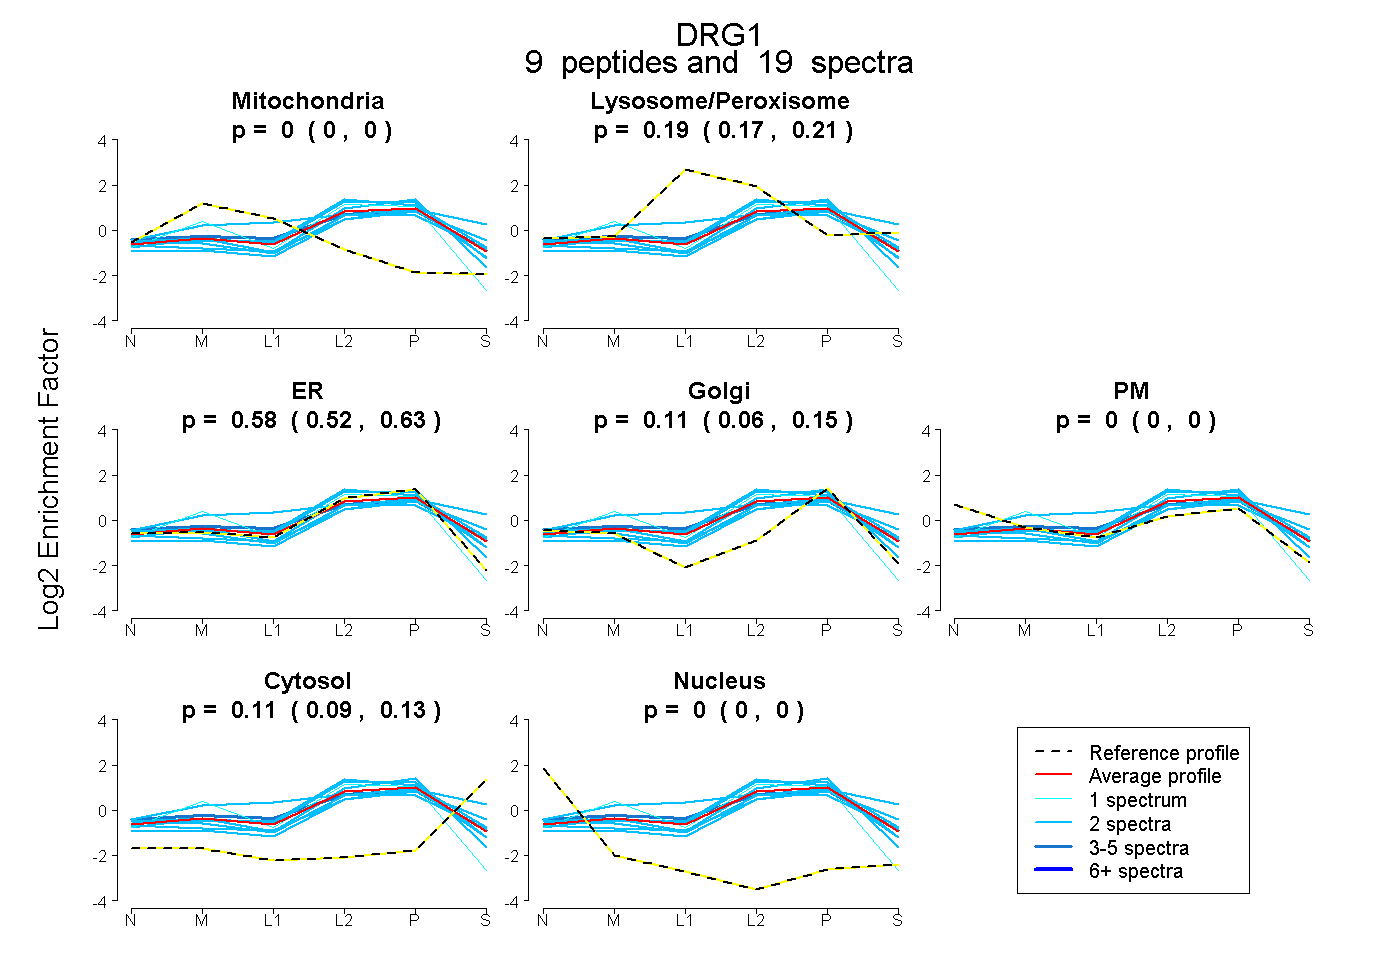
0.000 | 0.000
0.167 | 0.214
0.518 | 0.634
0.063 | 0.154
0.000 | 0.000
0.094 | 0.126
0.000 | 0.000