 15
15peptides
spectra
0.000 | 0.000
0.000 | 0.000
0.000 | 0.000
0.823 | 0.835
0.000 | 0.000
0.000 | 0.000
0.112 | 0.131
0.040 | 0.055
| Plot | Mito | Lyso | Perox | ER | Golgi | PM | Cytosol | Nucleus | |||||
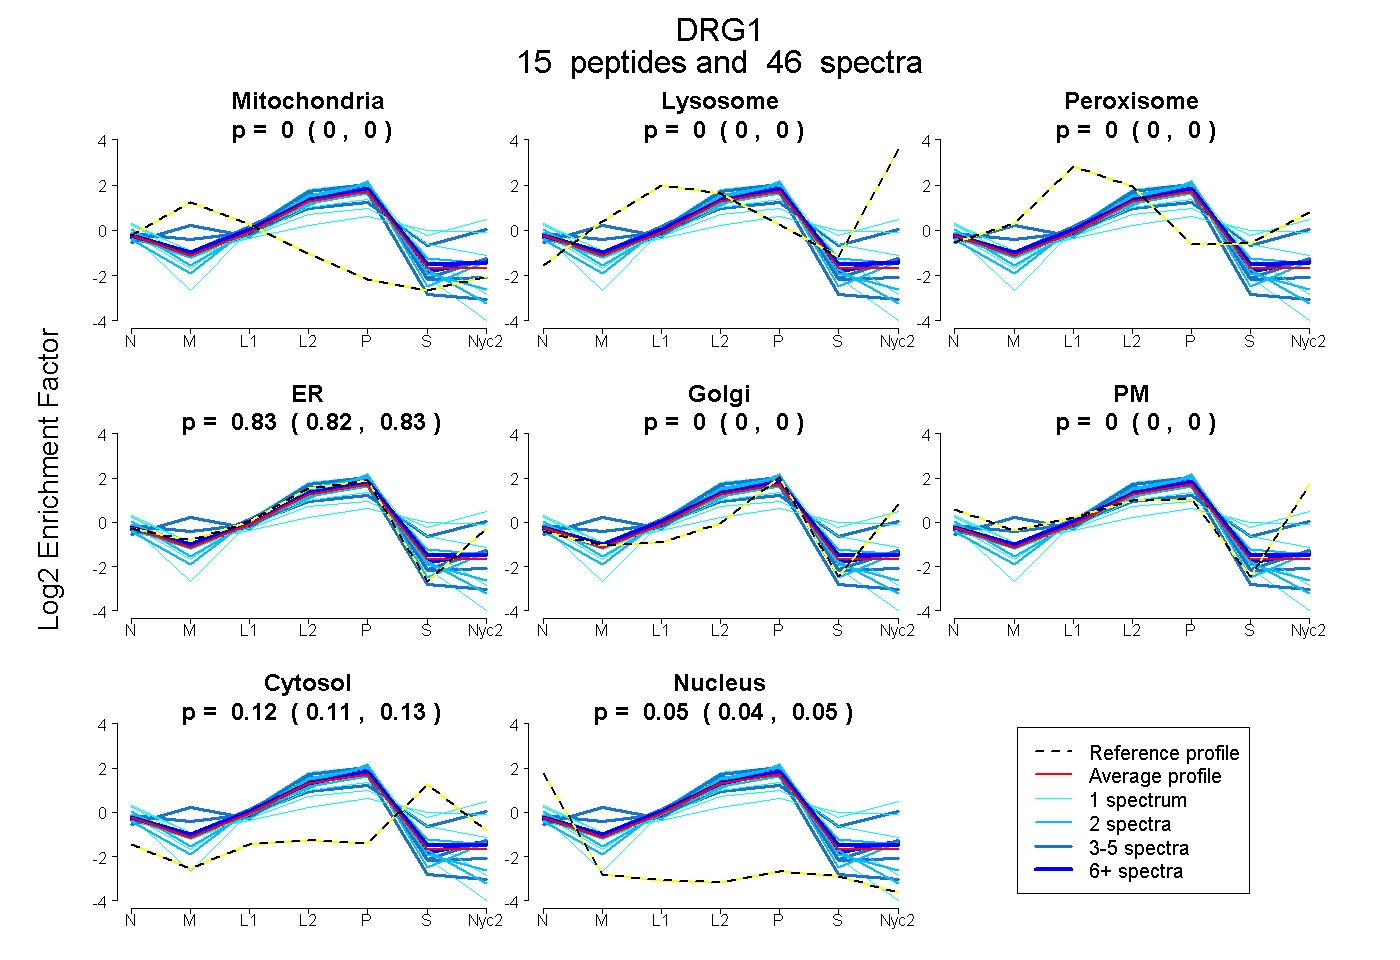
| Expt A |
15 peptides |
46 spectra |
|
0.000 0.000 | 0.000 |
0.000 0.000 | 0.000 |
0.000 0.000 | 0.000 |
0.830 0.823 | 0.835 |
0.000 0.000 | 0.000 |
0.000 0.000 | 0.000 |
0.122 0.112 | 0.131 |
0.048 0.040 | 0.055 |
| 4 spectra, ATAHHLGLLK | 0.000 | 0.000 | 0.201 | 0.395 | 0.148 | 0.057 | 0.199 | 0.000 | ||
| 1 spectrum, IDQISIEELDIIYK | 0.000 | 0.000 | 0.023 | 0.679 | 0.000 | 0.000 | 0.293 | 0.005 | ||
| 6 spectra, WNFDDLLEK | 0.000 | 0.000 | 0.000 | 0.846 | 0.000 | 0.000 | 0.150 | 0.005 | ||
| 1 spectrum, DHTLEDEDVIQIVK | 0.000 | 0.000 | 0.000 | 0.831 | 0.000 | 0.000 | 0.000 | 0.169 | ||
| 2 spectra, IWDYLK | 0.000 | 0.000 | 0.000 | 0.937 | 0.000 | 0.000 | 0.000 | 0.063 | ||
| 2 spectra, IGFVGFPSVGK | 0.000 | 0.000 | 0.000 | 0.775 | 0.000 | 0.000 | 0.222 | 0.003 | ||
| 3 spectra, IIENELEGFGIR | 0.000 | 0.000 | 0.000 | 0.943 | 0.000 | 0.000 | 0.040 | 0.017 | ||
| 1 spectrum, GQLPDYTSPVVLPYSR | 0.000 | 0.000 | 0.000 | 0.730 | 0.000 | 0.000 | 0.176 | 0.095 | ||
| 4 spectra, GGGGGGPGEGFDVAK | 0.002 | 0.000 | 0.000 | 0.910 | 0.000 | 0.000 | 0.012 | 0.076 | ||
| 13 spectra, IAEIEAEMAR | 0.000 | 0.000 | 0.000 | 0.873 | 0.000 | 0.000 | 0.105 | 0.022 | ||
| 1 spectrum, SGTLAK | 0.000 | 0.000 | 0.077 | 0.188 | 0.000 | 0.317 | 0.418 | 0.000 | ||
| 2 spectra, VYIPCIYVLNK | 0.000 | 0.000 | 0.000 | 0.796 | 0.000 | 0.000 | 0.066 | 0.138 | ||
| 1 spectrum, IQLLDLPGIIEGAK | 0.000 | 0.000 | 0.086 | 0.174 | 0.000 | 0.424 | 0.316 | 0.000 | ||
| 2 spectra, SDATADDLIDVVEGNR | 0.000 | 0.000 | 0.000 | 0.846 | 0.000 | 0.000 | 0.016 | 0.138 | ||
| 3 spectra, IHNADVTLR | 0.236 | 0.000 | 0.000 | 0.746 | 0.000 | 0.000 | 0.000 | 0.018 |
| Plot | Mito | Lyso or Perox | ER | Golgi | PM | Cytosol | Nucleus | ||||||
| Expt B |
9 peptides |
19 spectra |
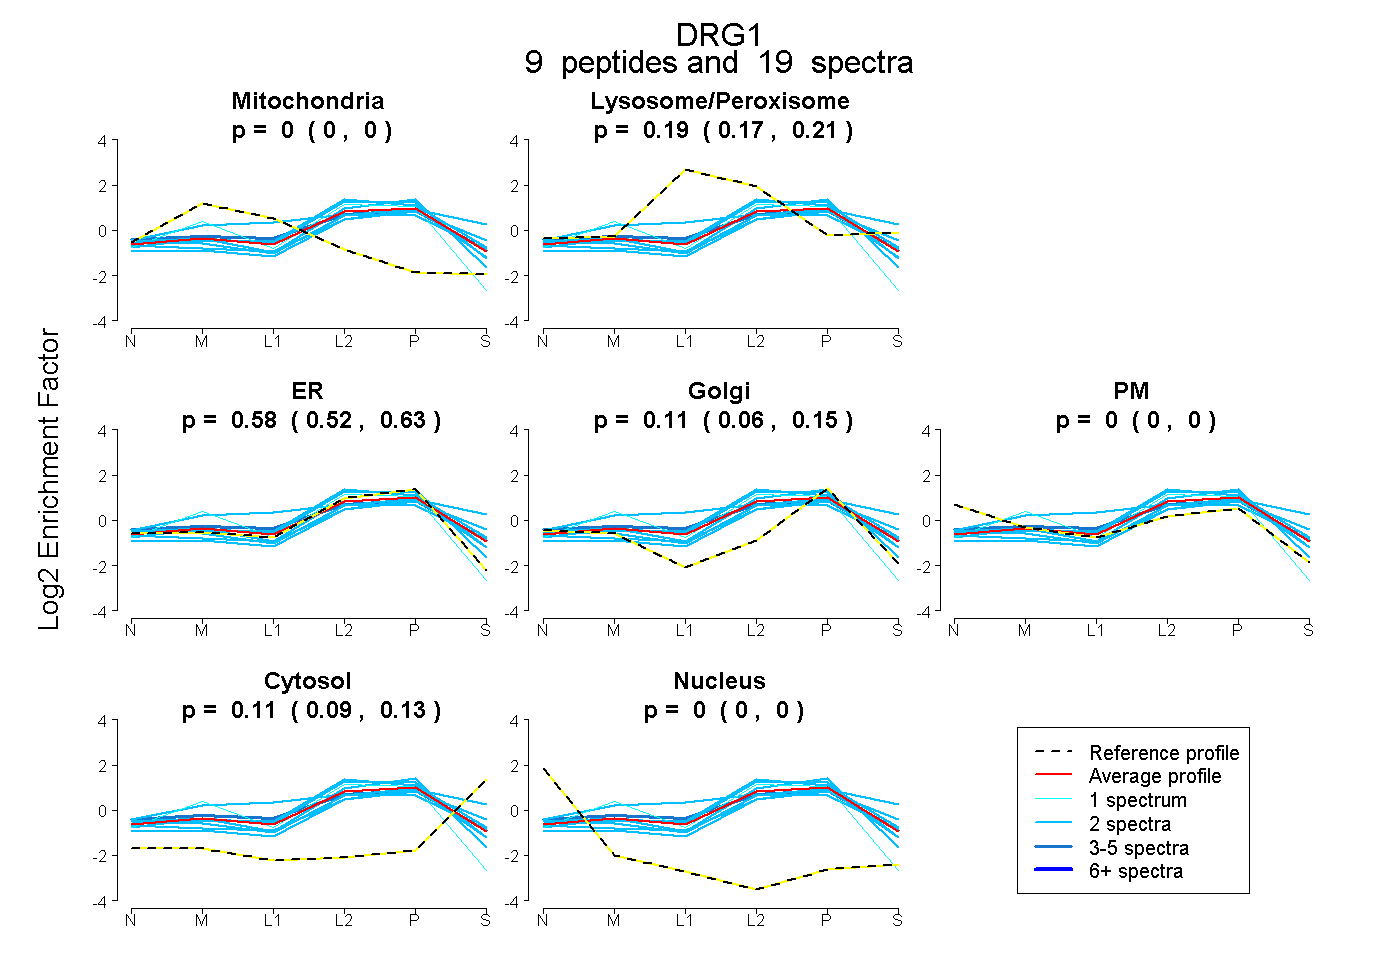 |
0.000 0.000 | 0.000 |
0.191 0.167 | 0.214 |
0.583 0.518 | 0.634 |
0.115 0.063 | 0.154 |
0.000 0.000 | 0.000 |
0.111 0.094 | 0.126 |
0.000 0.000 | 0.000 |
|||
| Plot | Lyso | Other | |||||||||||
| Expt C |
14 peptides |
42 spectra |
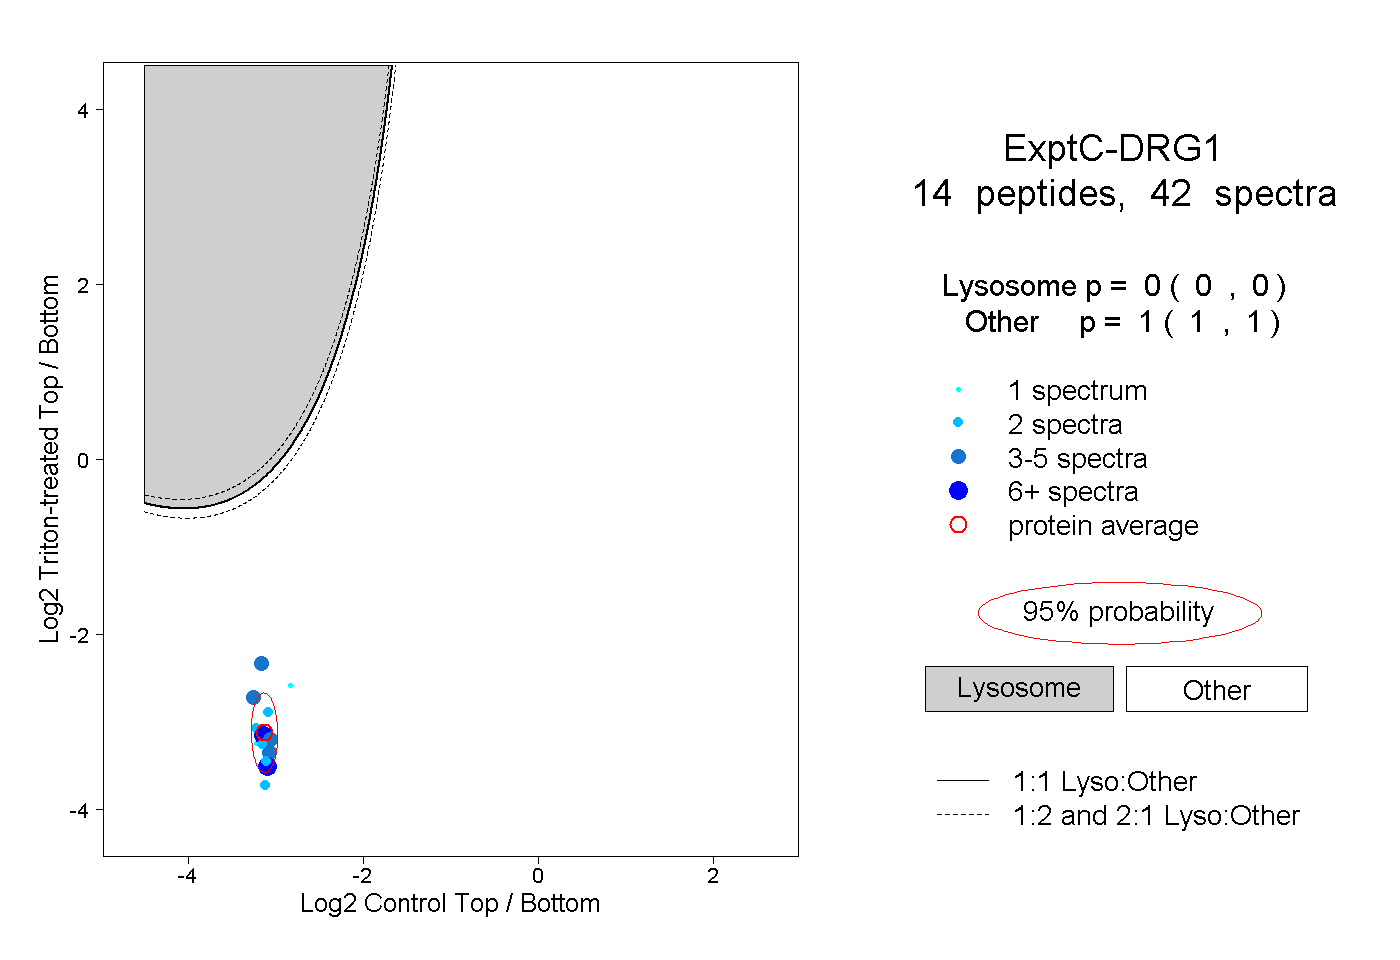 |
0.000 0.000 | 0.000 |
1.000 1.000 | 1.000 |
||||||||
| Plot | Lyso | Other | |||||||||||
| Expt D |
5 peptides |
9 spectra |
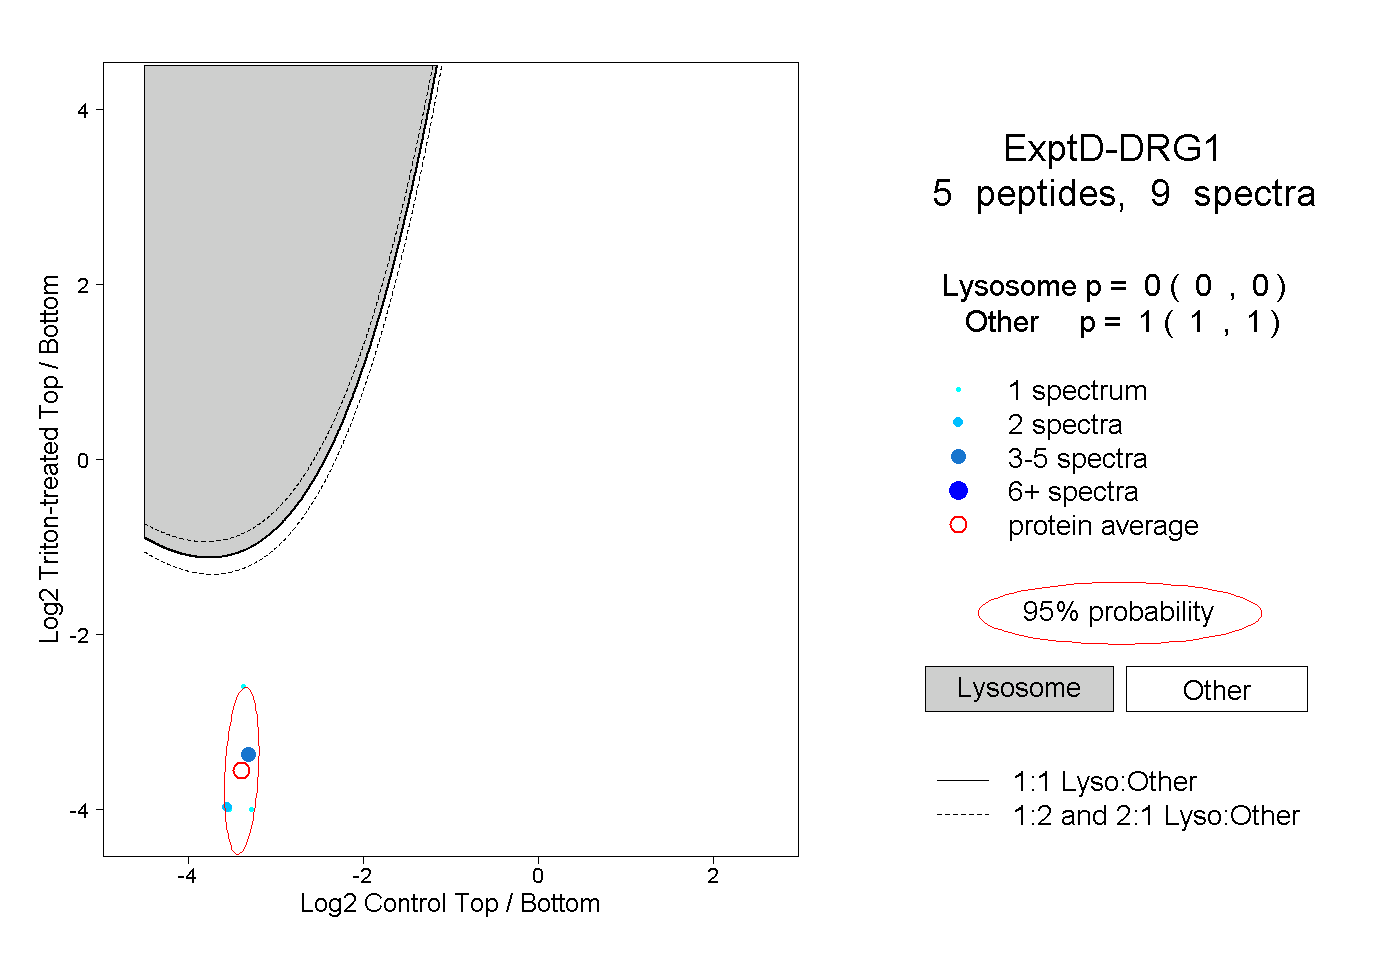 |
0.000 0.000 | 0.000 |
1.000 1.000 | 1.000 |