 2
2peptides
spectra
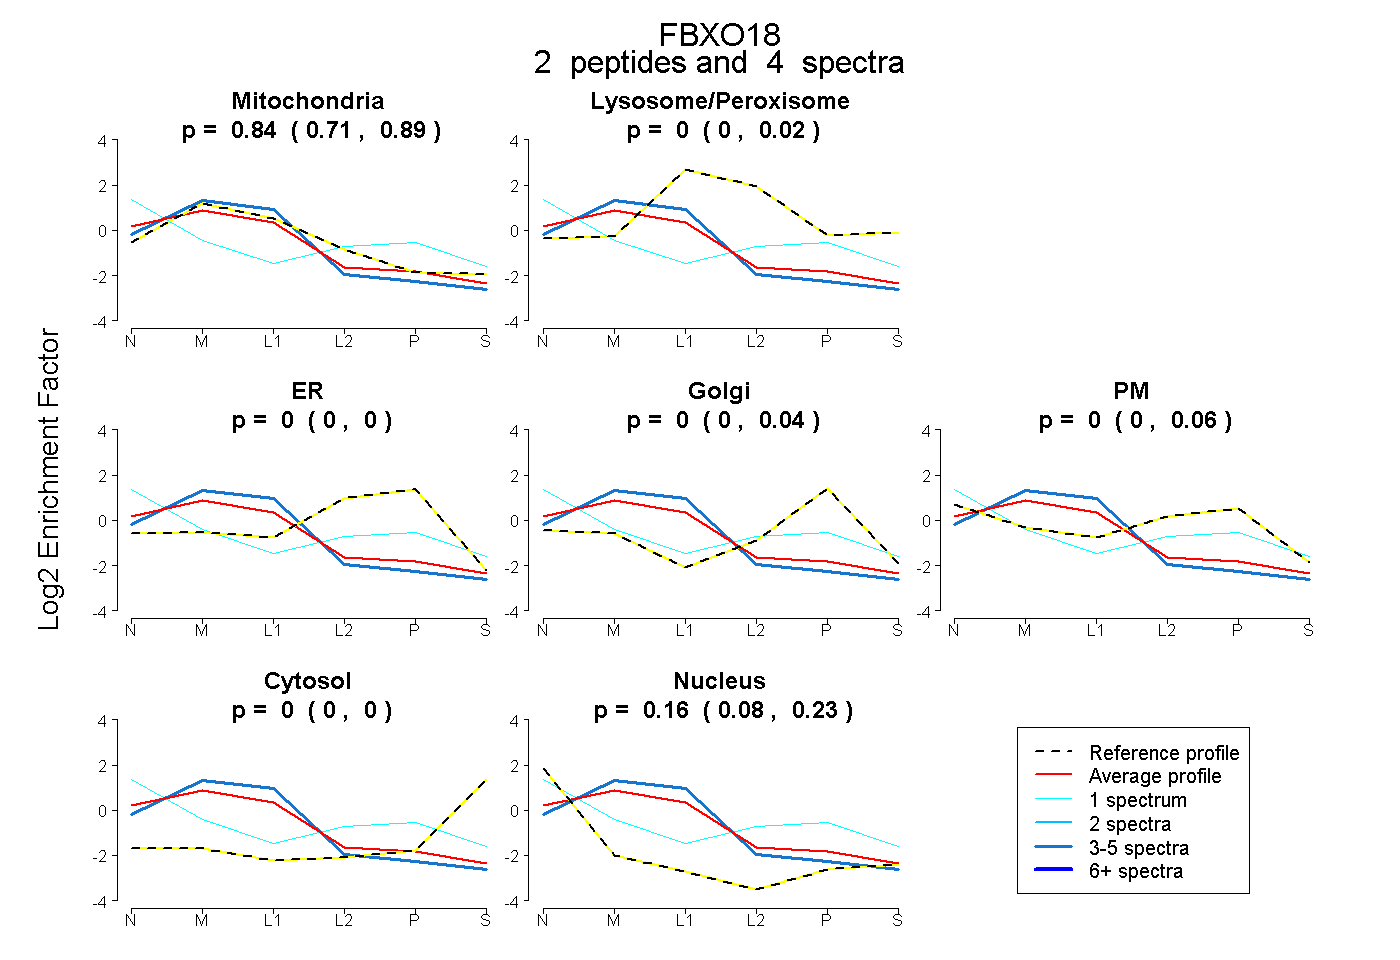
0.715 | 0.890
0.000 | 0.021
0.000 | 0.000
0.000 | 0.040
0.000 | 0.059
0.000 | 0.000
0.084 | 0.230
1peptide
spectra
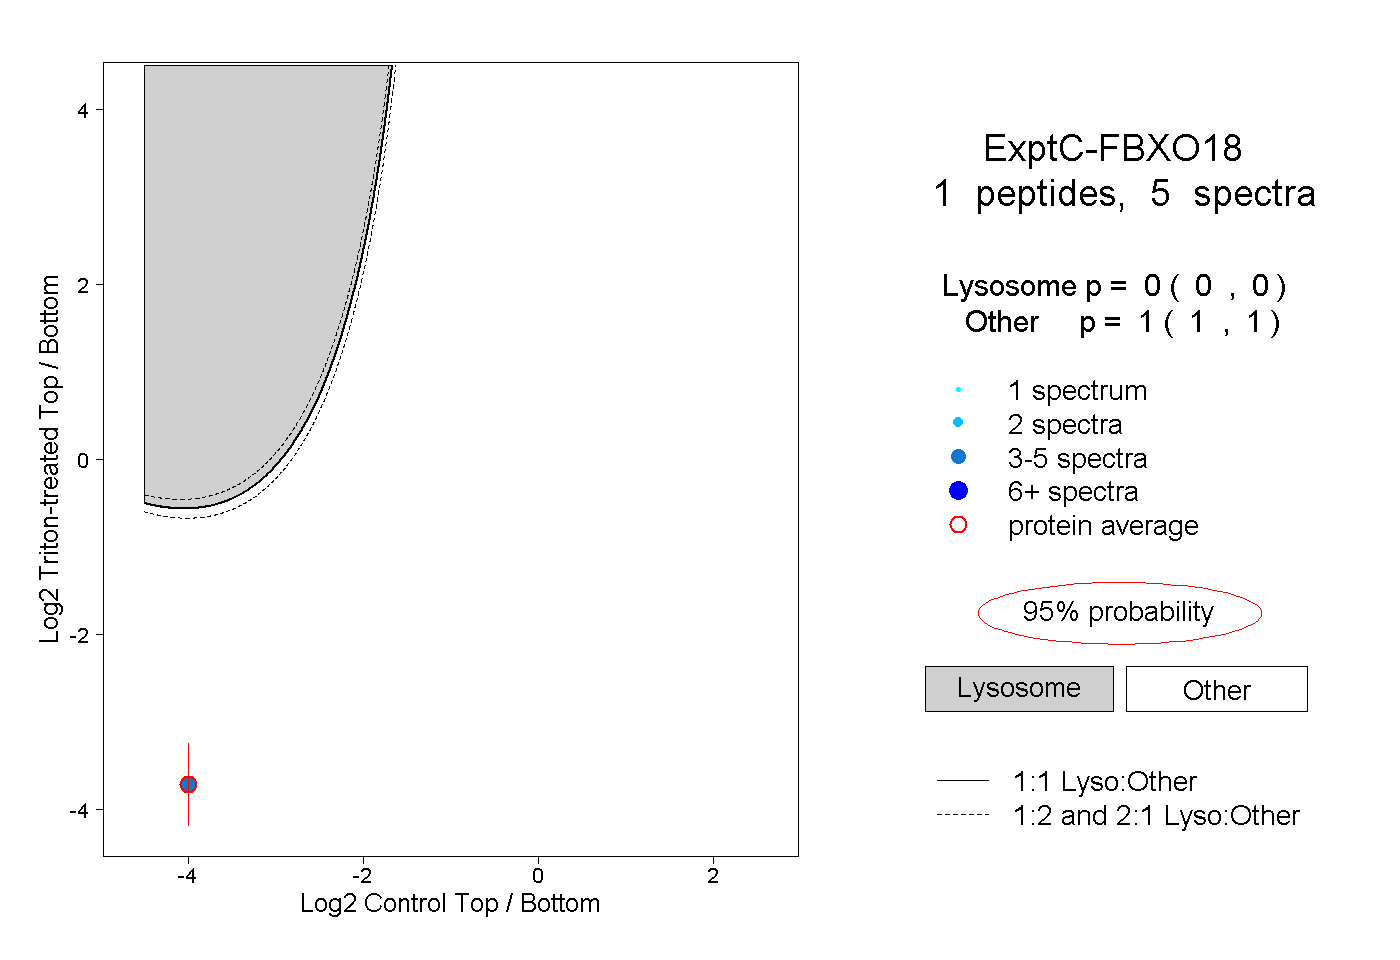
0.000 | 0.000
1.000 | 1.000
2peptides
spectra
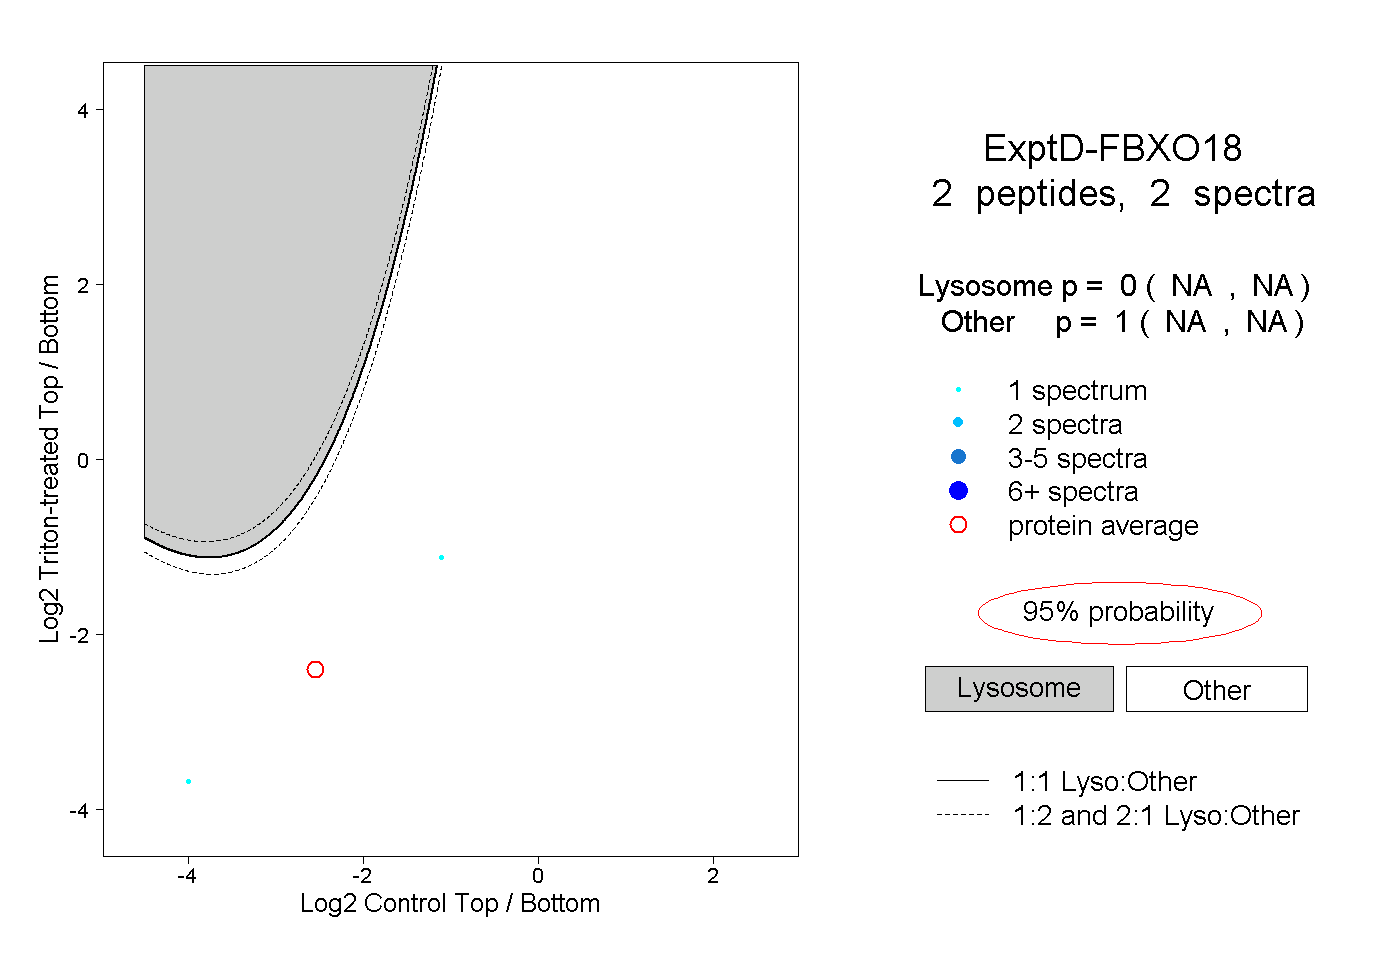
NA | NA
NA | NA