 1
1peptide
spectra
0.000 | 0.000
0.094 | 0.147
0.067 | 0.153
0.000 | 0.000
0.400 | 0.512
0.168 | 0.291
0.038 | 0.093
0.000 | 0.000
1peptide
spectra
0.000 | 0.000
1.000 | 1.000
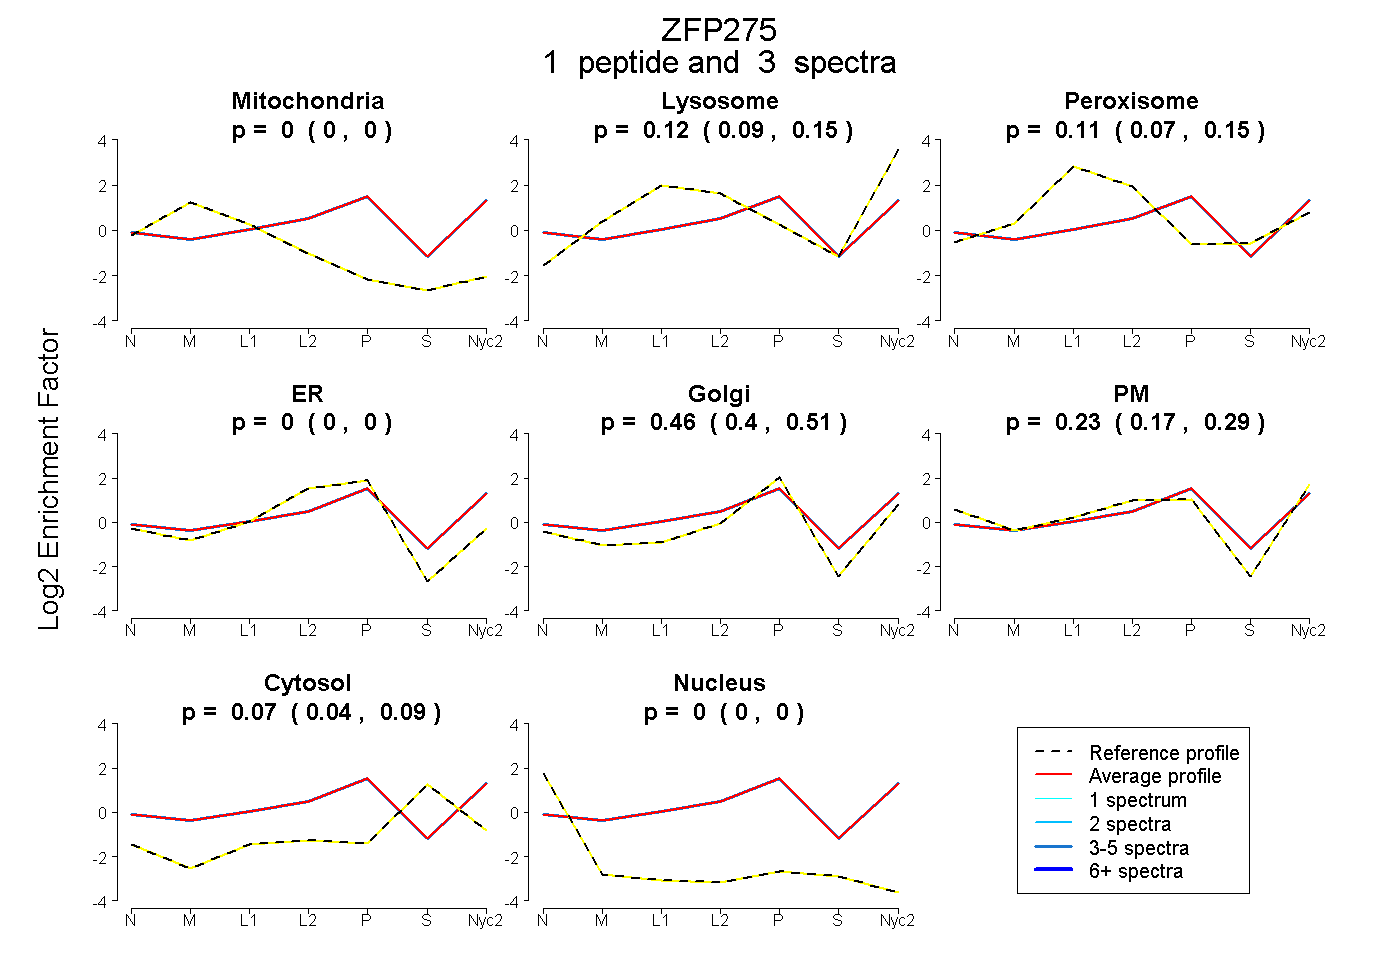
| Plot | Mito | Lyso | Perox | ER | Golgi | PM | Cytosol | Nucleus | |||||
| Expt A |
1 peptide |
3 spectra |
|
0.000 0.000 | 0.000 |
0.124 0.094 | 0.147 |
0.112 0.067 | 0.153 |
0.000 0.000 | 0.000 |
0.463 0.400 | 0.512 |
0.233 0.168 | 0.291 |
0.068 0.038 | 0.093 |
0.000 0.000 | 0.000 |
||
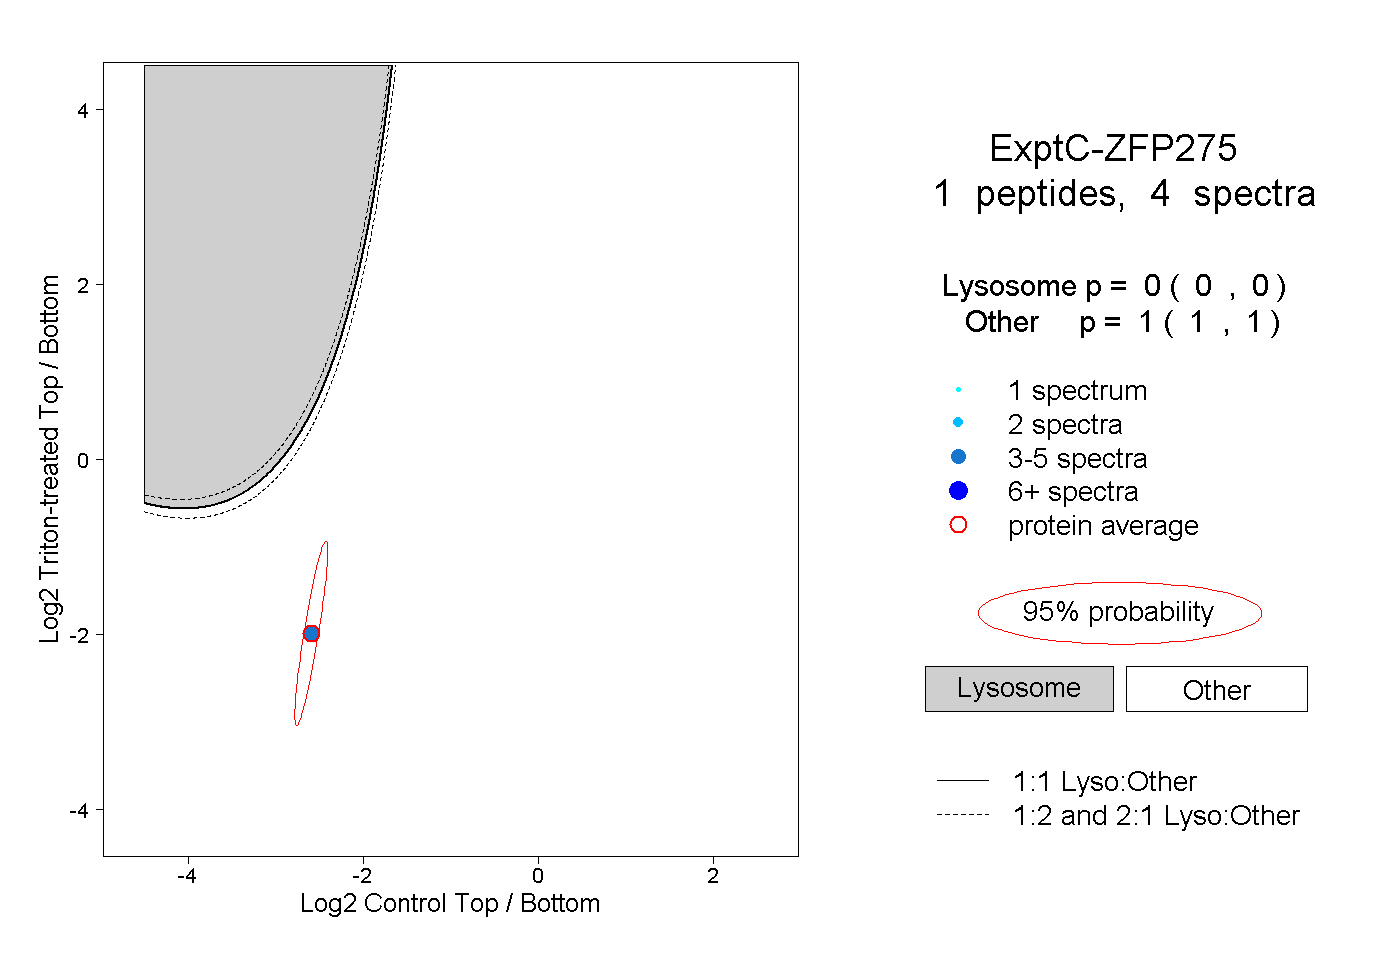
| Plot | Lyso | Other | |||||||||||
| Expt C |
1 peptide |
4 spectra |
|
0.000 0.000 | 0.000 |
1.000 1.000 | 1.000 |