10
10peptides
spectra
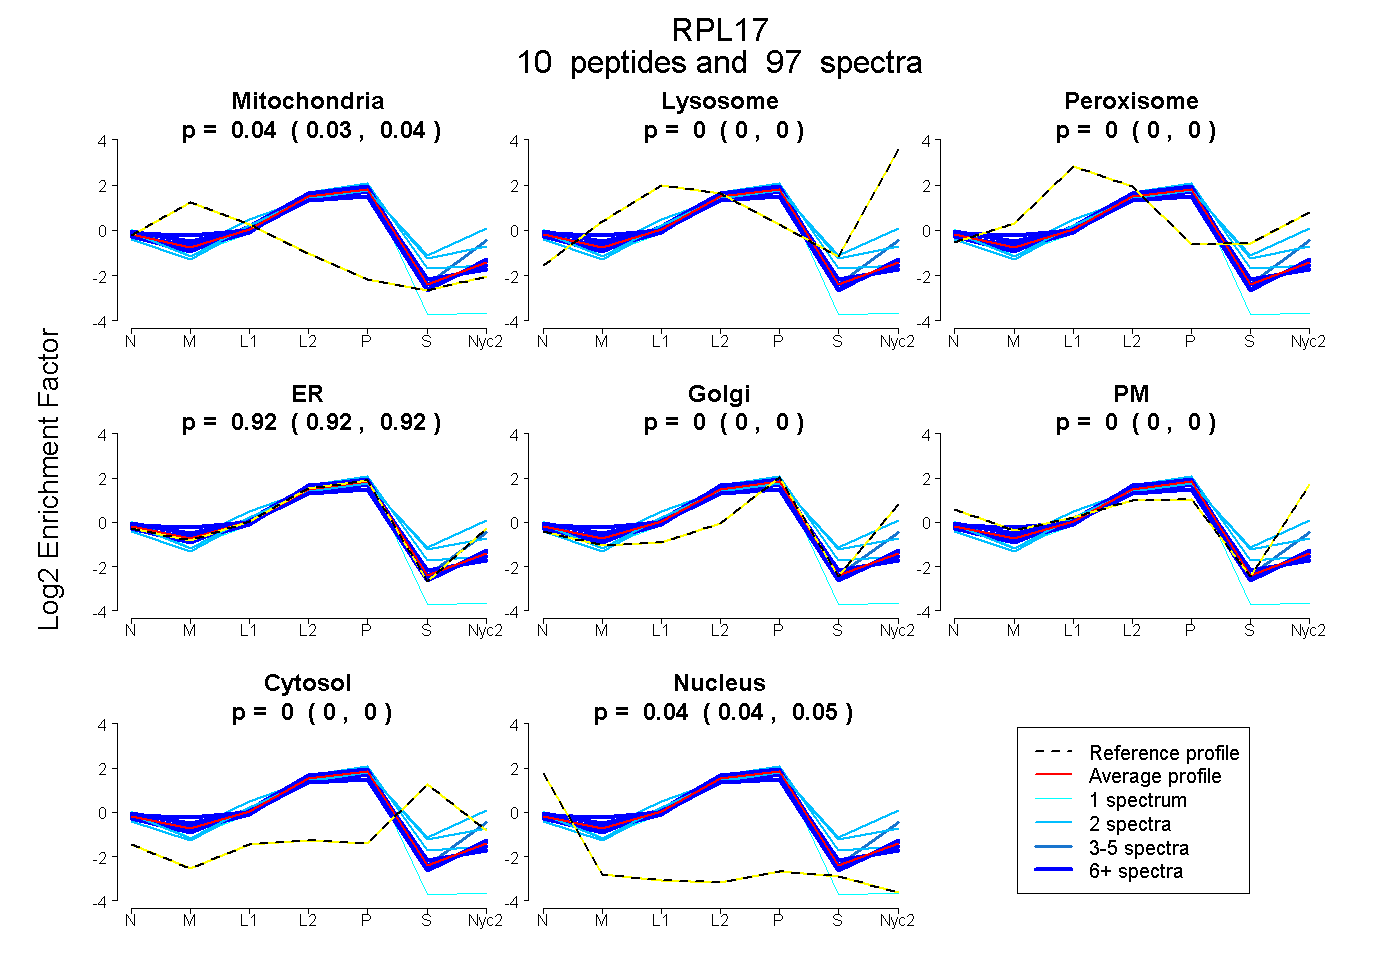
0.033 | 0.040
0.000 | 0.000
0.000 | 0.000
0.916 | 0.920
0.000 | 0.000
0.000 | 0.000
0.000 | 0.000
0.042 | 0.046
6peptides
spectra
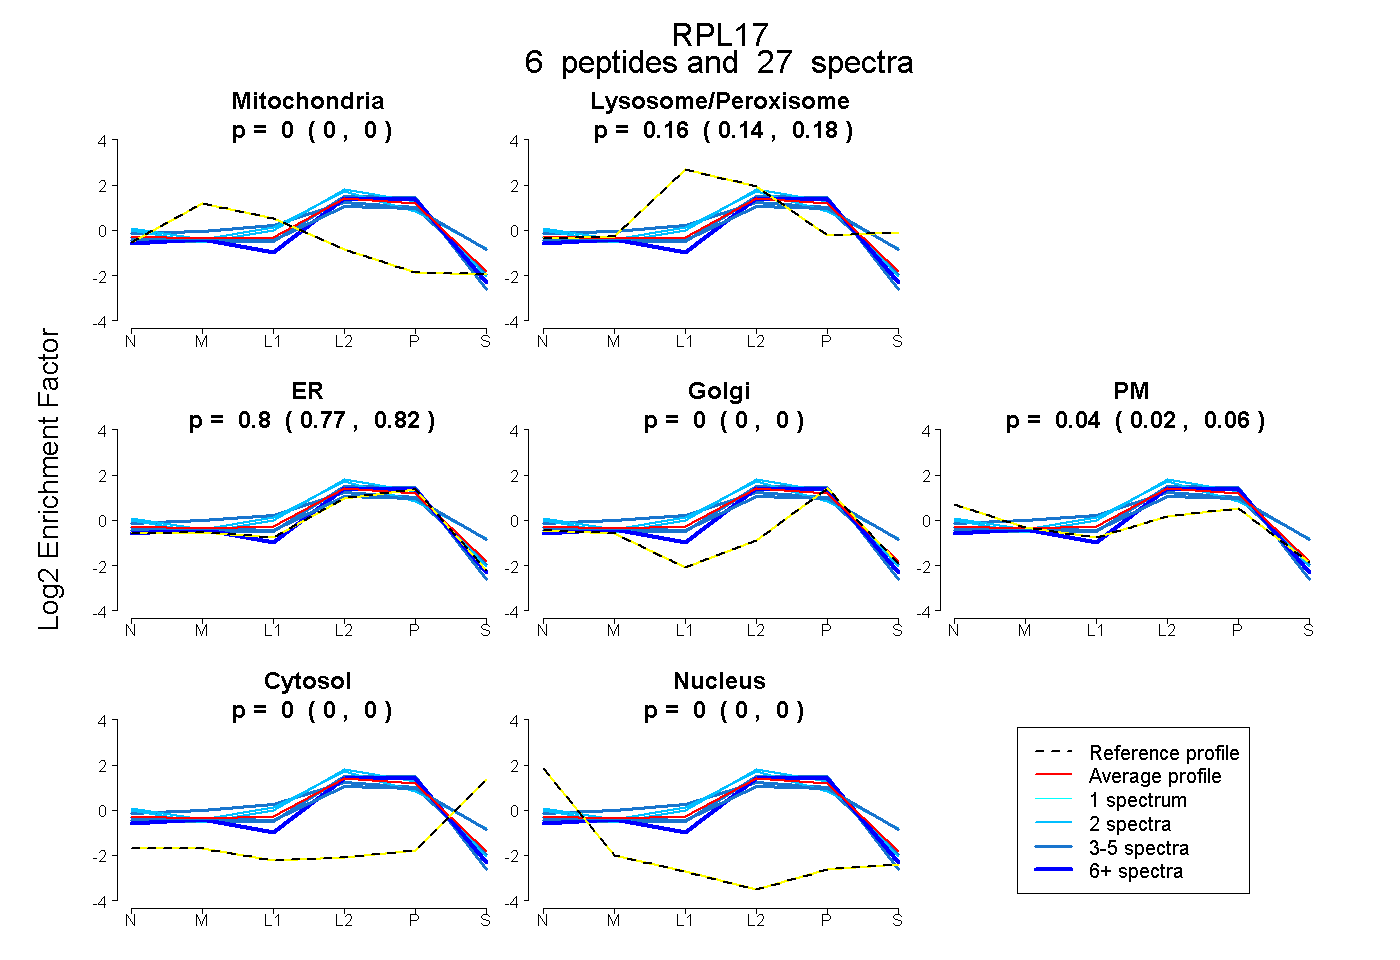
0.000 | 0.000
0.145 | 0.178
0.766 | 0.820
0.000 | 0.000
0.015 | 0.061
0.000 | 0.000
0.000 | 0.000
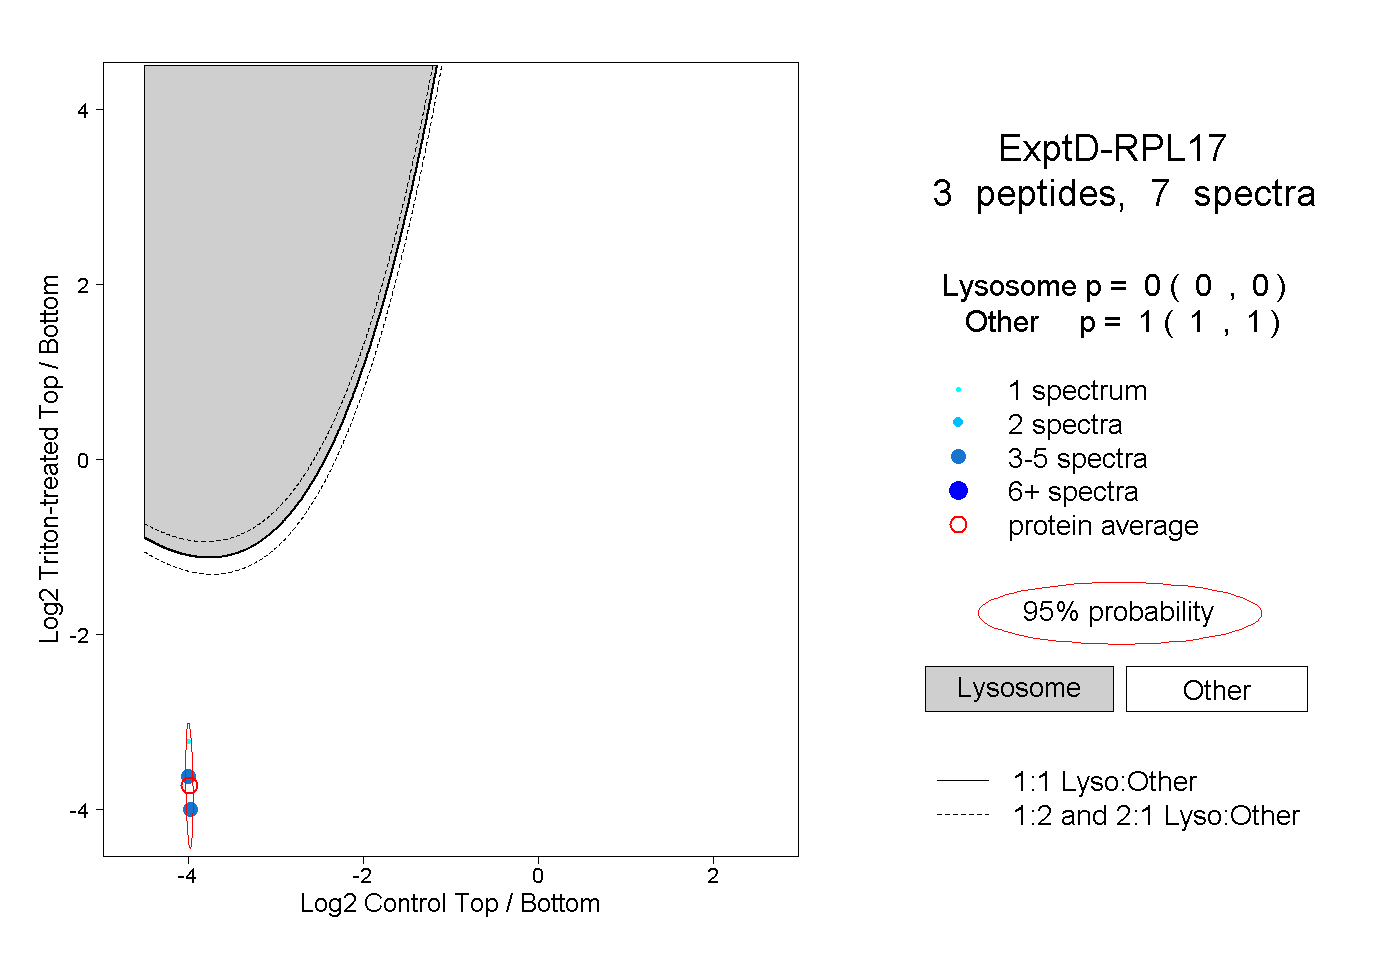
9peptides
spectra
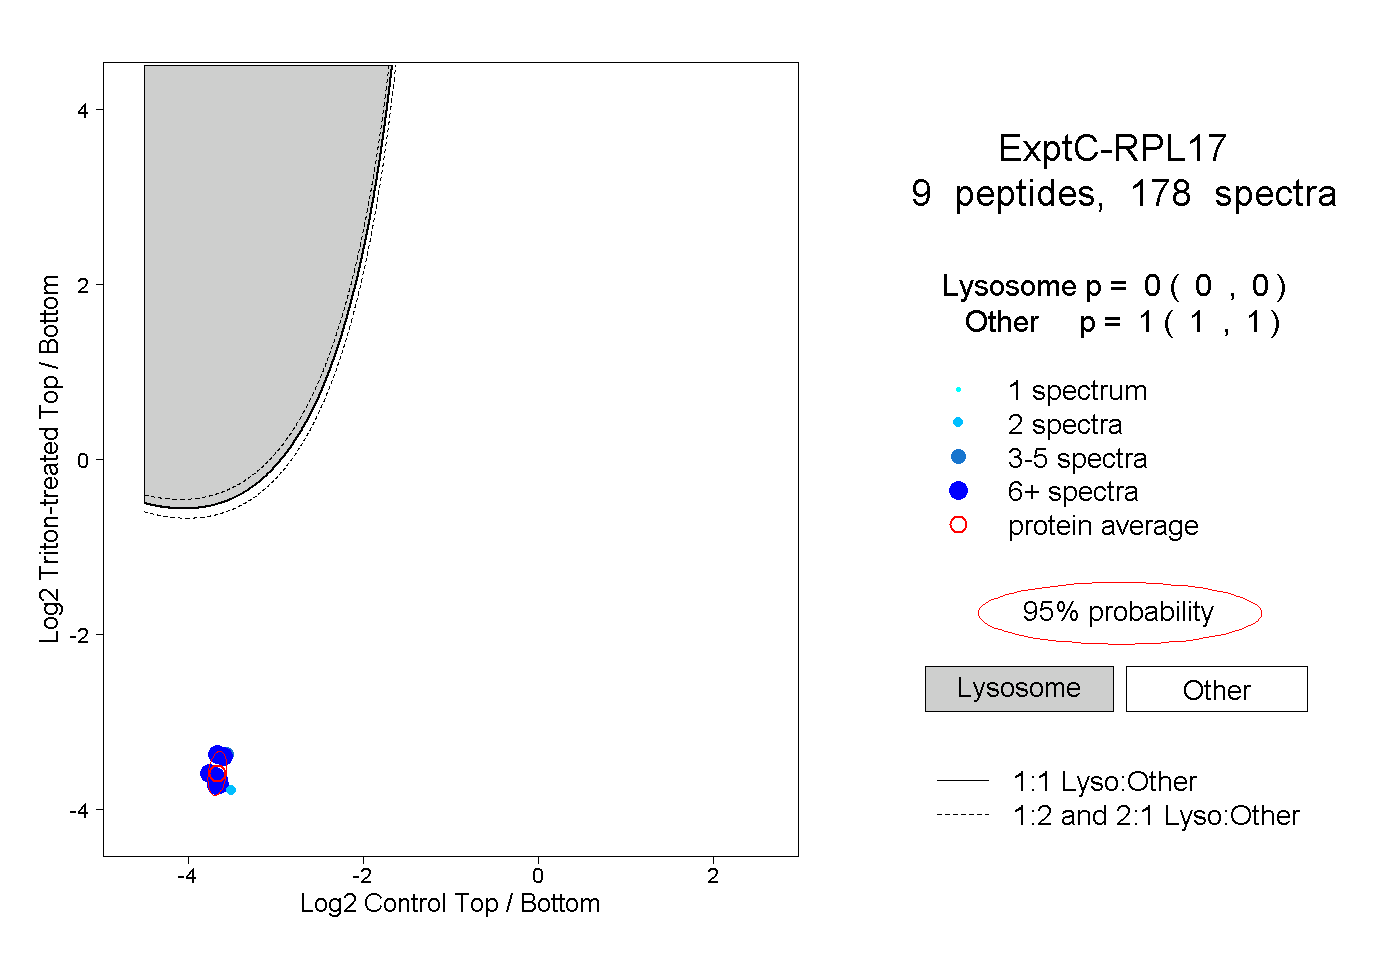
0.000 | 0.000
1.000 | 1.000