RPL17
[ENSRNOP00000025217]
Main page
| | | Plot |
Mito |
Lyso |
|
Perox |
ER |
Golgi |
PM |
Cytosol |
Nucleus |
|
| Expt A |
 10
10
peptides |
97
spectra |
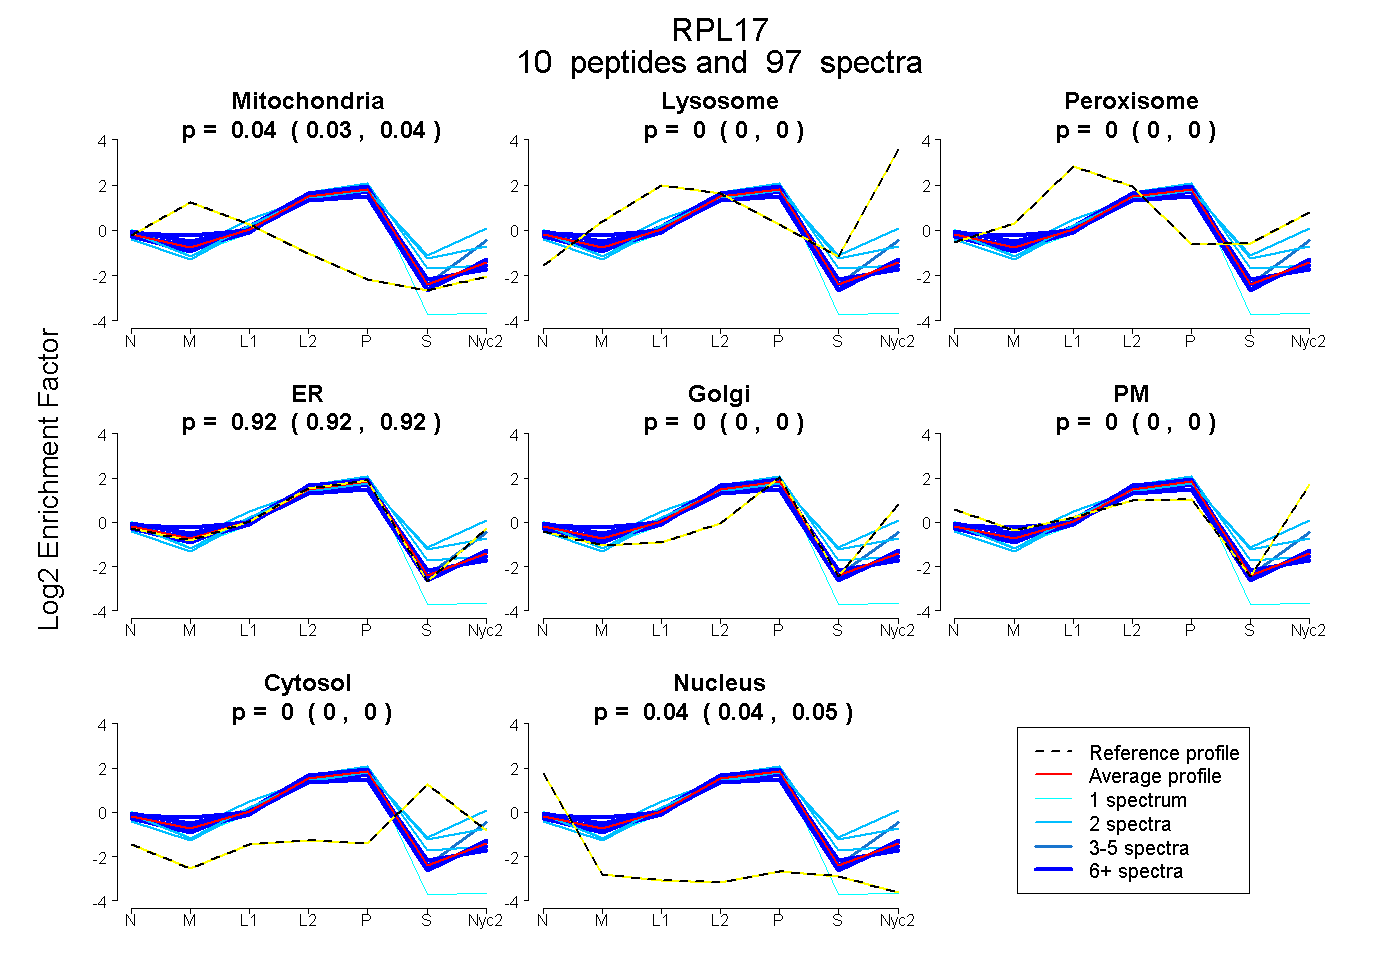 |
0.037
0.033 | 0.040 |
0.000
0.000 | 0.000 |
|
0.000
0.000 | 0.000 |
0.918
0.916 | 0.920 |
0.000
0.000 | 0.000 |
0.000
0.000 | 0.000 |
0.000
0.000 | 0.000 |
0.044
0.042 | 0.046 |
|
| | | Plot |
Mito |
|
Lyso or Perox |
|
ER |
Golgi |
PM |
Cytosol |
Nucleus |
|
| Expt B |
6
peptides |
27
spectra |
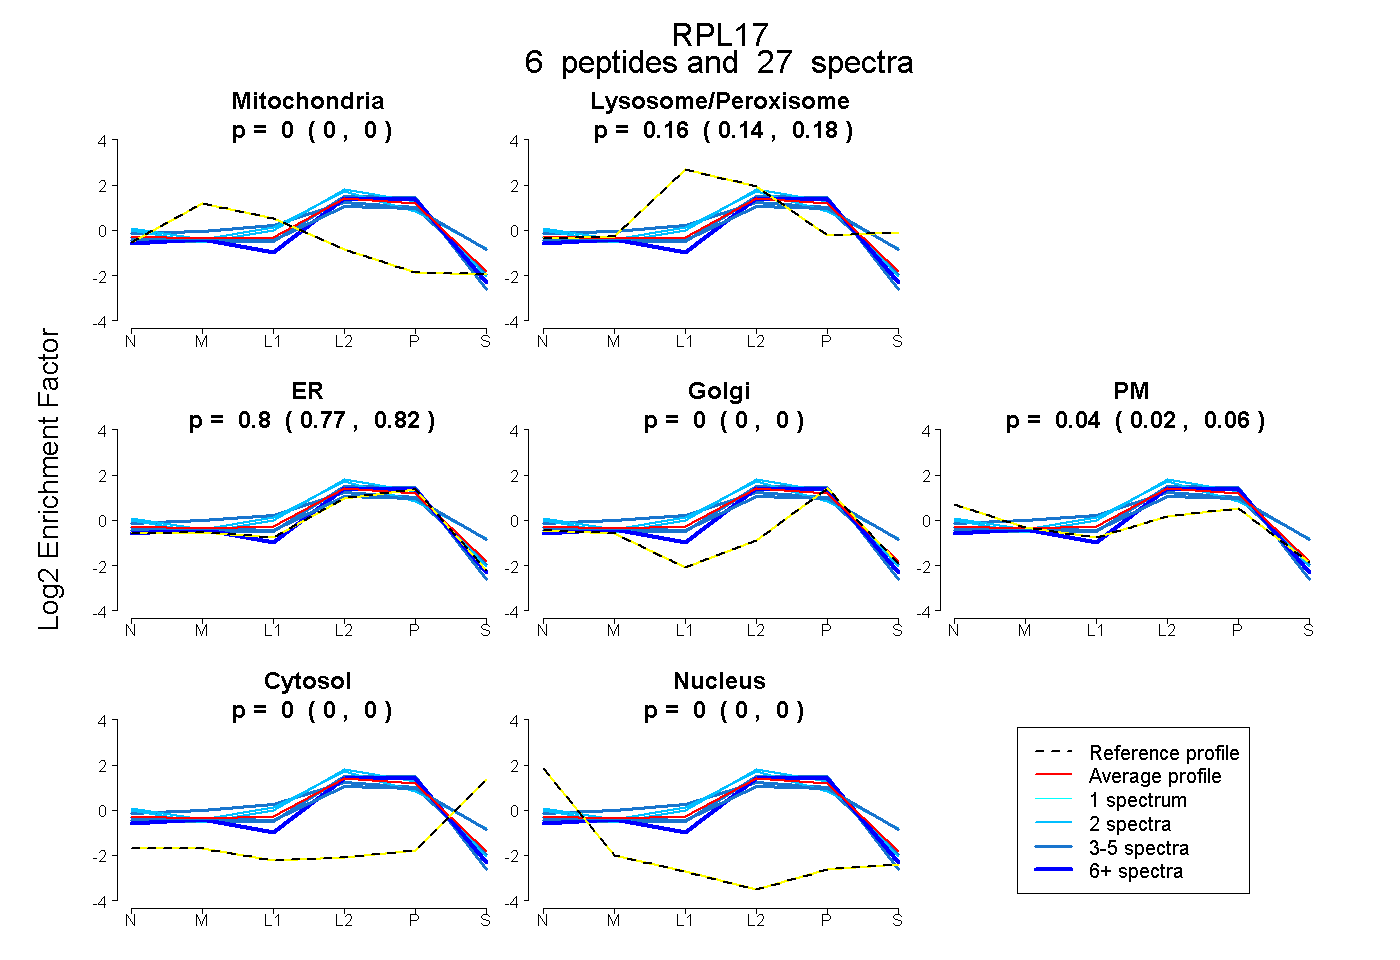 |
0.000
0.000 | 0.000 |
|
0.162
0.145 | 0.178 |
|
0.796
0.766 | 0.820 |
0.000
0.000 | 0.000 |
0.041
0.015 | 0.061 |
0.000
0.000 | 0.000 |
0.000
0.000 | 0.000 |
|
| 2 spectra, QCVPFR |
0.000 |
|
0.203 |
|
0.797 |
0.000 |
0.000 |
0.000 |
0.000 |
|
| 3 spectra, YSLDPENPTK |
0.000 |
|
0.241 |
|
0.541 |
0.087 |
0.052 |
0.079 |
0.000 |
|
| 4 spectra, ETAQAIK |
0.018 |
|
0.233 |
|
0.622 |
0.000 |
0.126 |
0.000 |
0.000 |
|
| 12 spectra, SAEFLLHMLK |
0.000 |
|
0.000 |
|
1.000 |
0.000 |
0.000 |
0.000 |
0.000 |
|
| 4 spectra, NAESNAELK |
0.000 |
|
0.025 |
|
0.975 |
0.000 |
0.000 |
0.000 |
0.000 |
|
| 2 spectra, QWGWTQGR |
0.000 |
|
0.373 |
|
0.432 |
0.000 |
0.195 |
0.000 |
0.000 |
|
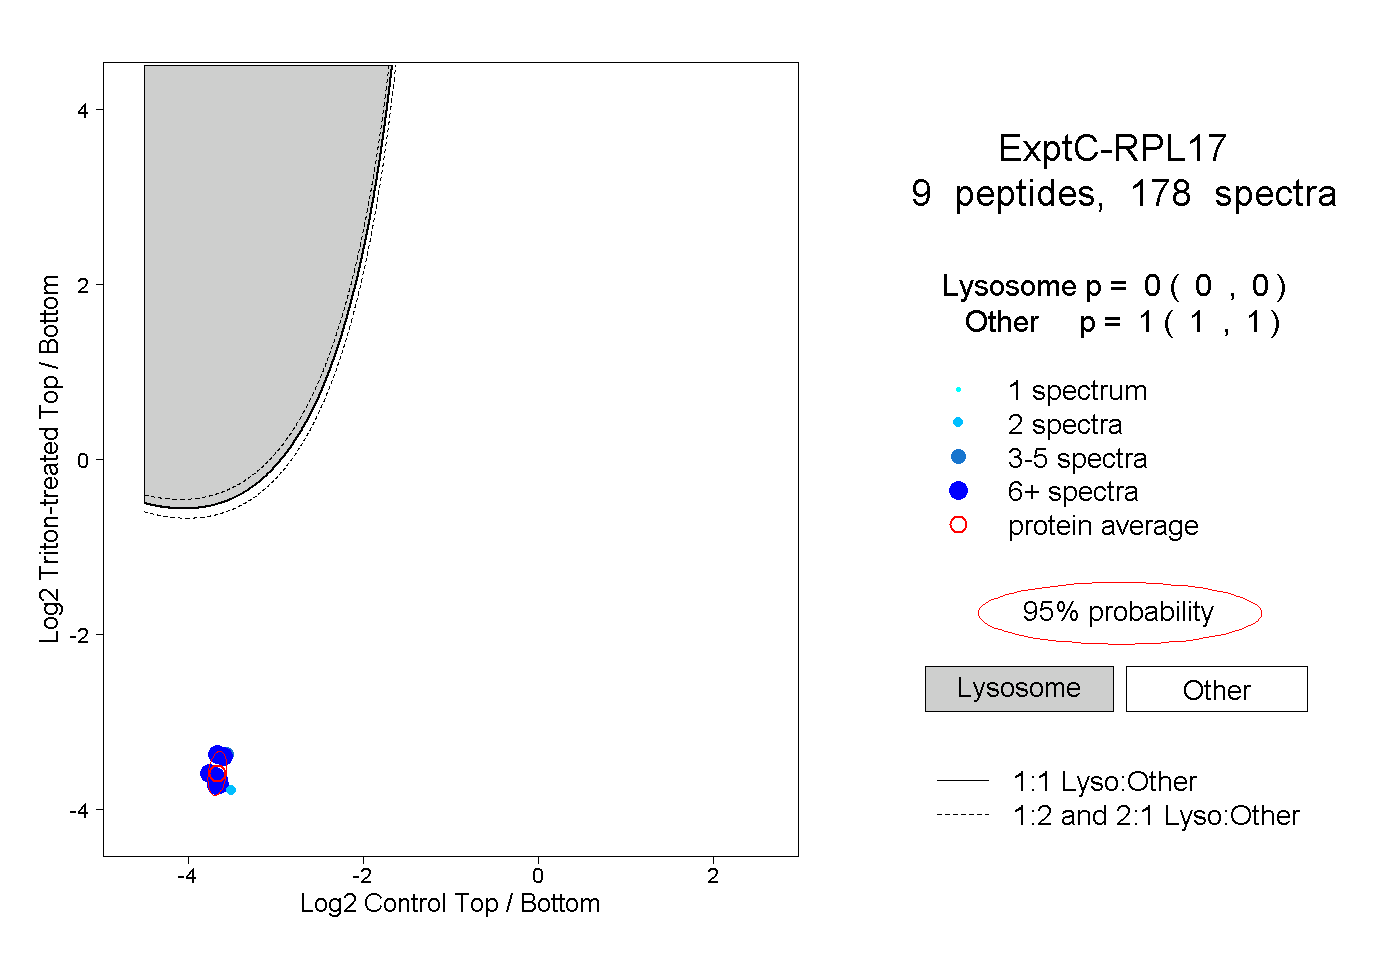
| | | Plot |
|
Lyso |
|
|
|
|
|
|
|
Other |
| Expt C |
9
peptides |
178
spectra |
 |
|
0.000
0.000 | 0.000 |
|
|
|
|
|
|
|
1.000
1.000 | 1.000 |
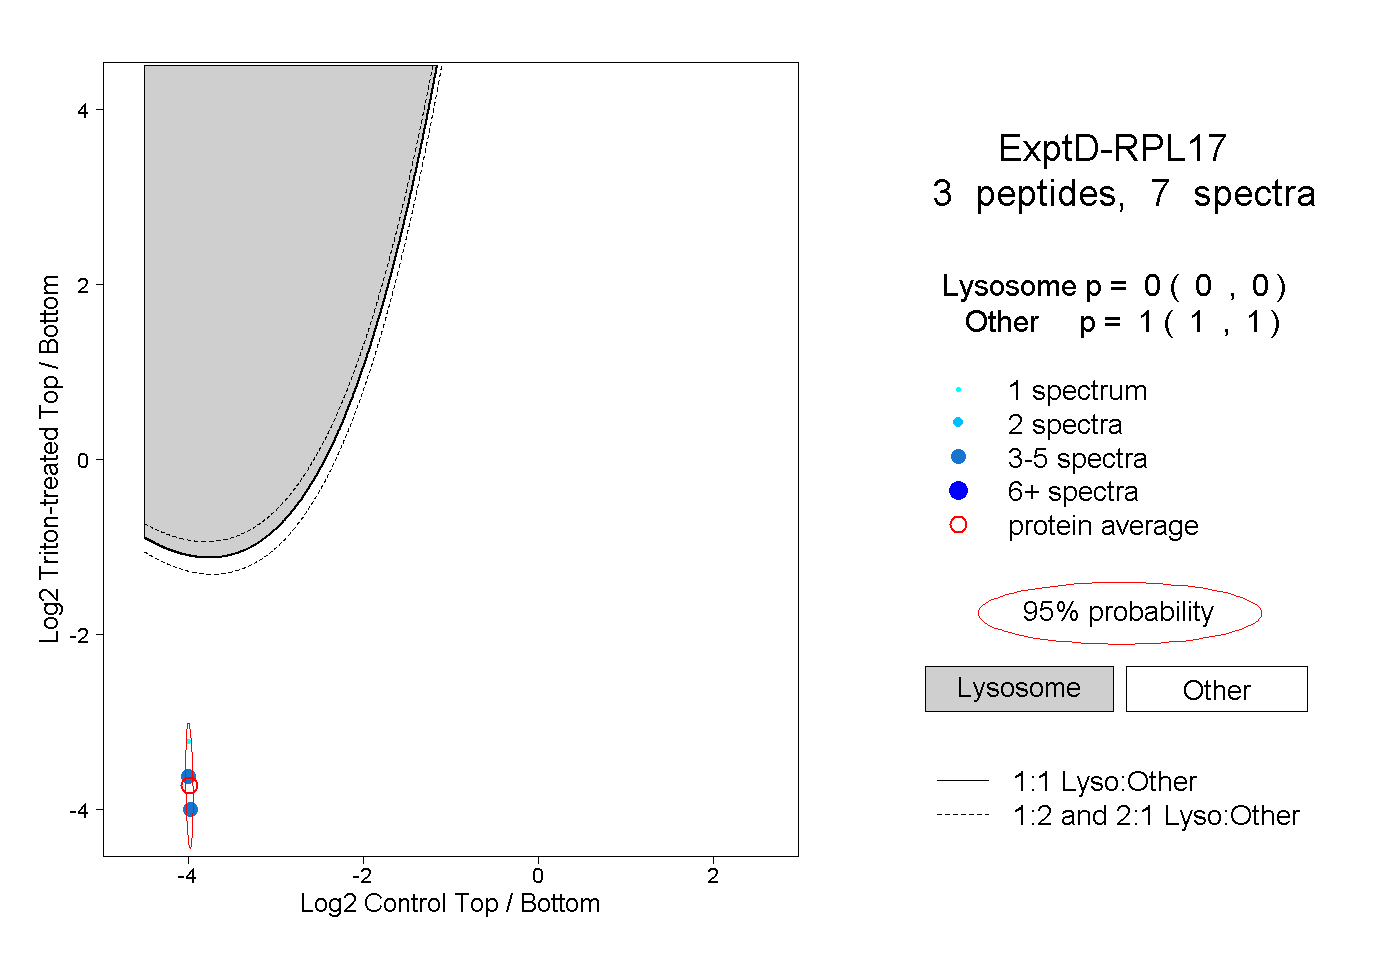
| | | Plot |
|
Lyso |
|
|
|
|
|
|
|
Other |
| Expt D |
3
peptides |
7
spectra |
 |
|
0.000
0.000 | 0.000 |
|
|
|
|
|
|
|
1.000
1.000 | 1.000 |