 10
10peptides
spectra
0.033 | 0.040
0.000 | 0.000
0.000 | 0.000
0.916 | 0.920
0.000 | 0.000
0.000 | 0.000
0.000 | 0.000
0.042 | 0.046
| Plot | Mito | Lyso | Perox | ER | Golgi | PM | Cytosol | Nucleus | |||||
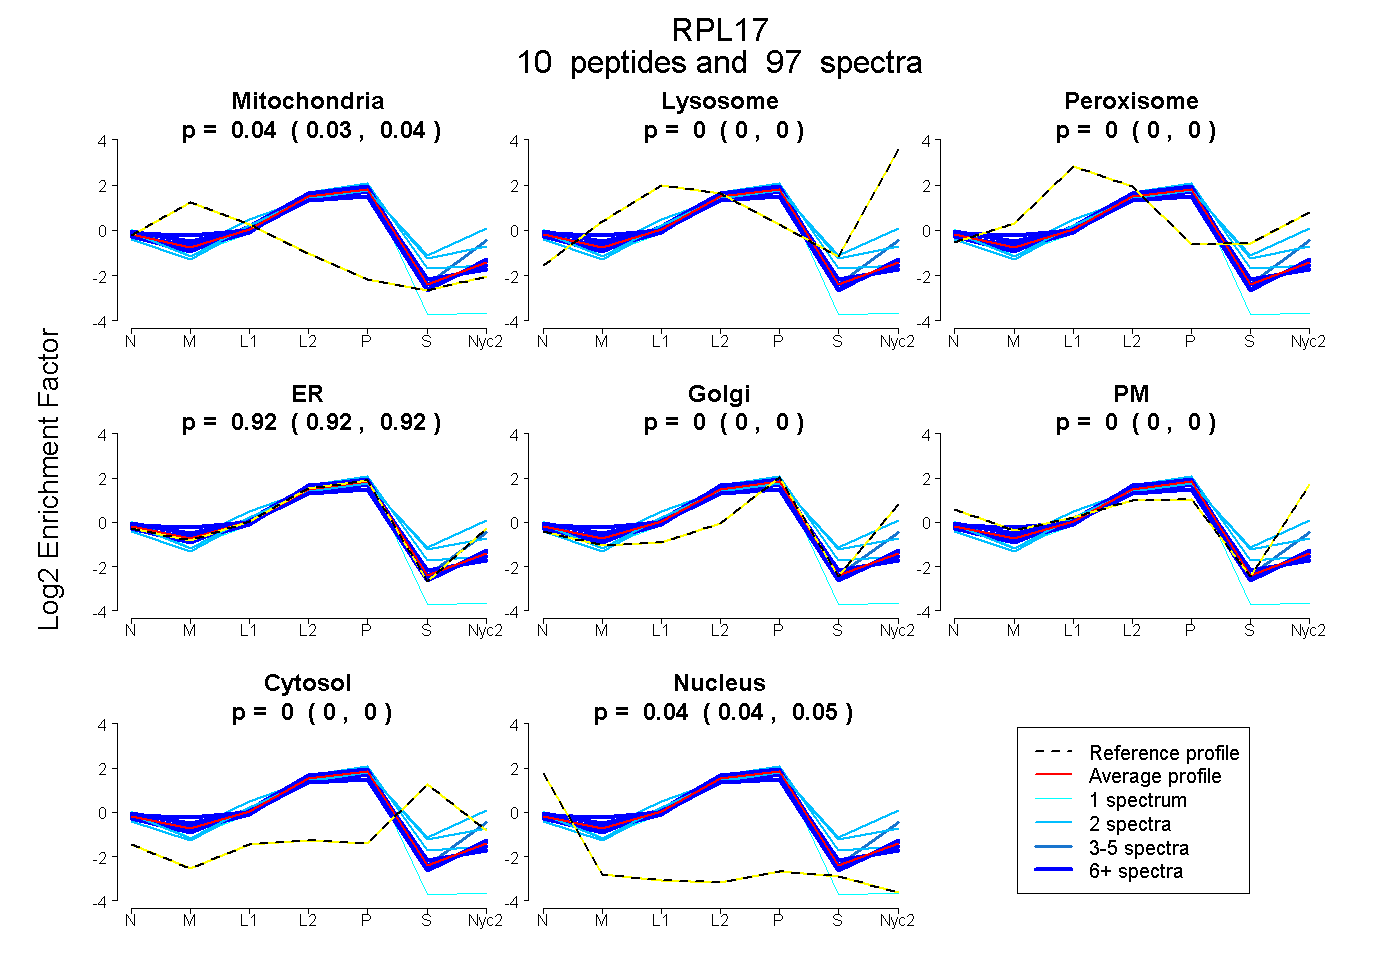
| Expt A |
10 peptides |
97 spectra |
|
0.037 0.033 | 0.040 |
0.000 0.000 | 0.000 |
0.000 0.000 | 0.000 |
0.918 0.916 | 0.920 |
0.000 0.000 | 0.000 |
0.000 0.000 | 0.000 |
0.000 0.000 | 0.000 |
0.044 0.042 | 0.046 |
| 3 spectra, DVTLK | 0.000 | 0.000 | 0.000 | 0.983 | 0.000 | 0.000 | 0.014 | 0.002 | ||
| 21 spectra, QCVPFR | 0.104 | 0.000 | 0.000 | 0.853 | 0.000 | 0.000 | 0.000 | 0.044 | ||
| 20 spectra, SAEFLLHMLK | 0.000 | 0.000 | 0.000 | 0.958 | 0.000 | 0.000 | 0.000 | 0.042 | ||
| 2 spectra, GLDVDSLVIEHIQVNK | 0.000 | 0.000 | 0.000 | 0.890 | 0.000 | 0.000 | 0.110 | 0.000 | ||
| 15 spectra, NAESNAELK | 0.009 | 0.000 | 0.000 | 0.928 | 0.000 | 0.000 | 0.000 | 0.063 | ||
| 2 spectra, YNGGVGR | 0.000 | 0.040 | 0.084 | 0.705 | 0.000 | 0.030 | 0.141 | 0.000 | ||
| 19 spectra, QWGWTQGR | 0.026 | 0.000 | 0.000 | 0.939 | 0.000 | 0.000 | 0.000 | 0.035 | ||
| 1 spectrum, EQIVPKPEEEVAQK | 0.000 | 0.000 | 0.000 | 0.811 | 0.000 | 0.000 | 0.000 | 0.189 | ||
| 12 spectra, YSLDPENPTK | 0.165 | 0.000 | 0.000 | 0.830 | 0.000 | 0.000 | 0.000 | 0.005 | ||
| 2 spectra, GMHIR | 0.000 | 0.000 | 0.143 | 0.746 | 0.000 | 0.000 | 0.111 | 0.000 |
| Plot | Mito | Lyso or Perox | ER | Golgi | PM | Cytosol | Nucleus | ||||||
| Expt B |
6 peptides |
27 spectra |
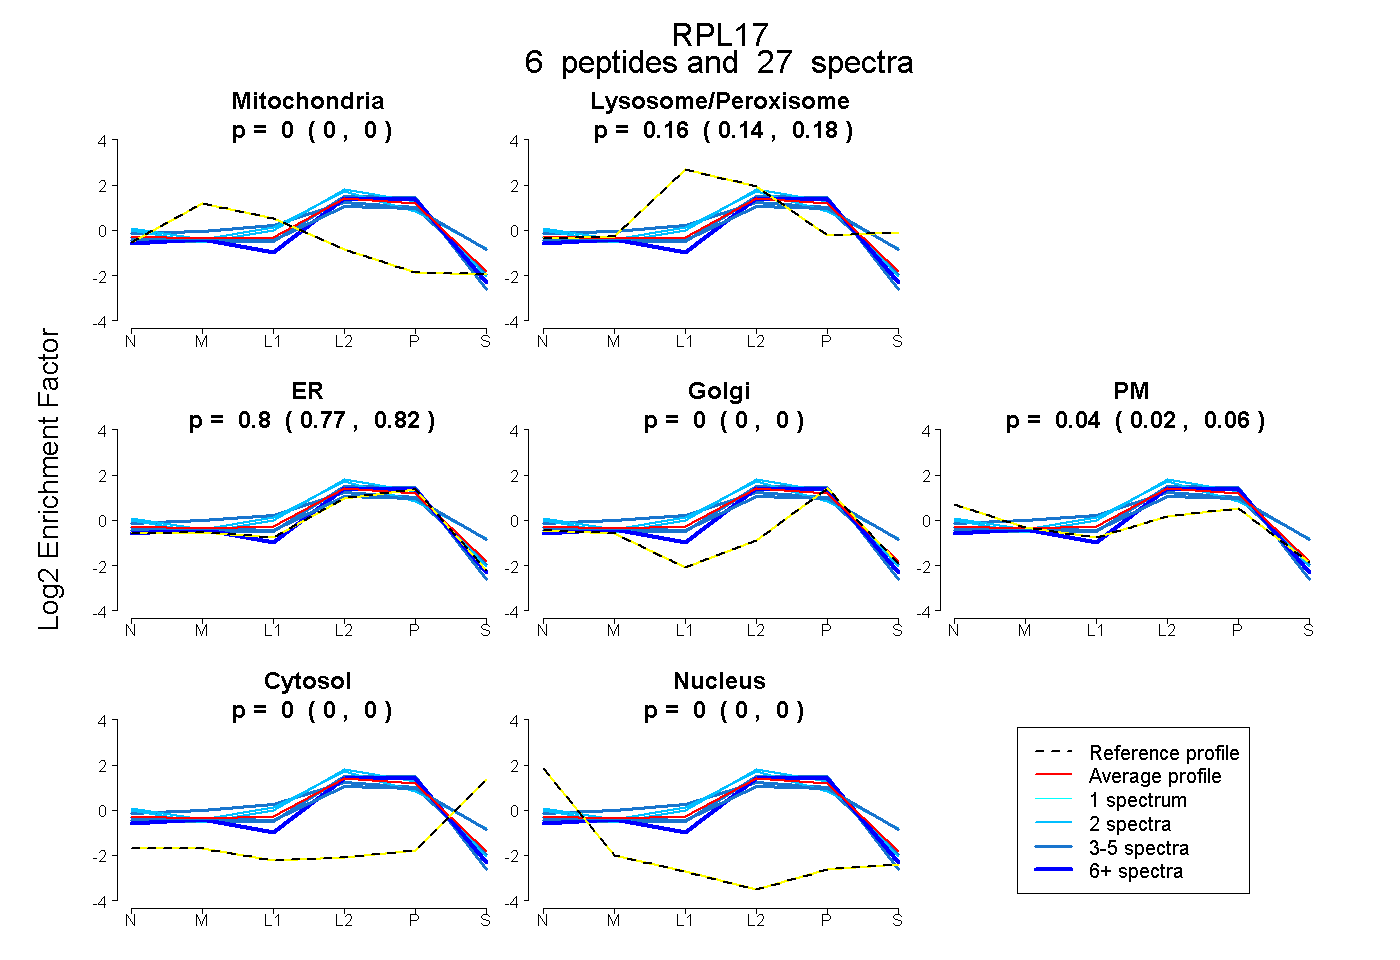 |
0.000 0.000 | 0.000 |
0.162 0.145 | 0.178 |
0.796 0.766 | 0.820 |
0.000 0.000 | 0.000 |
0.041 0.015 | 0.061 |
0.000 0.000 | 0.000 |
0.000 0.000 | 0.000 |
|||
| Plot | Lyso | Other | |||||||||||
| Expt C |
9 peptides |
178 spectra |
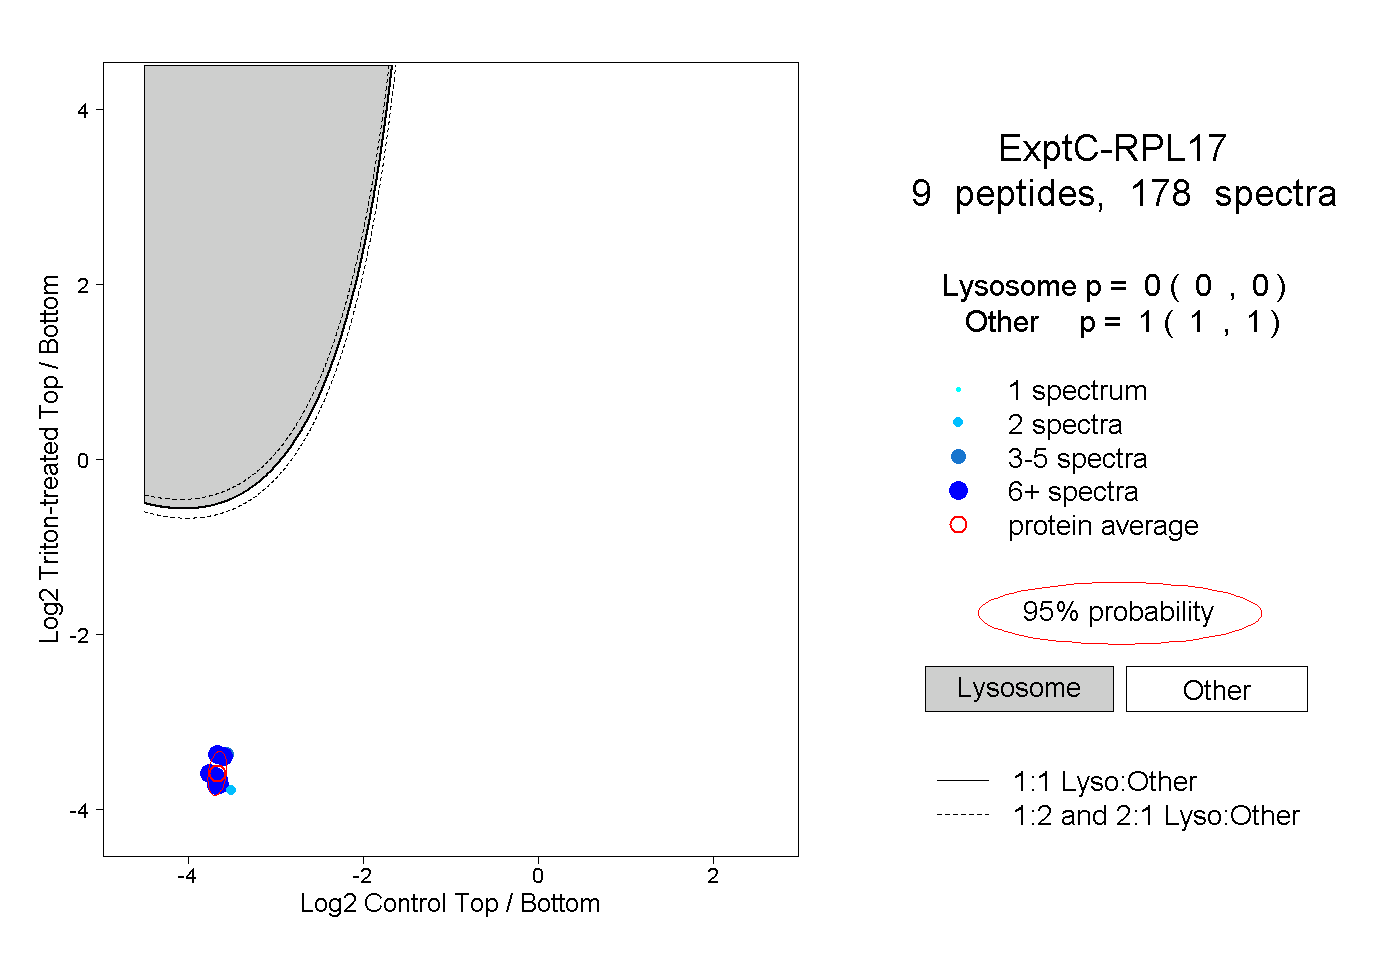 |
0.000 0.000 | 0.000 |
1.000 1.000 | 1.000 |
||||||||
| Plot | Lyso | Other | |||||||||||
| Expt D |
3 peptides |
7 spectra |
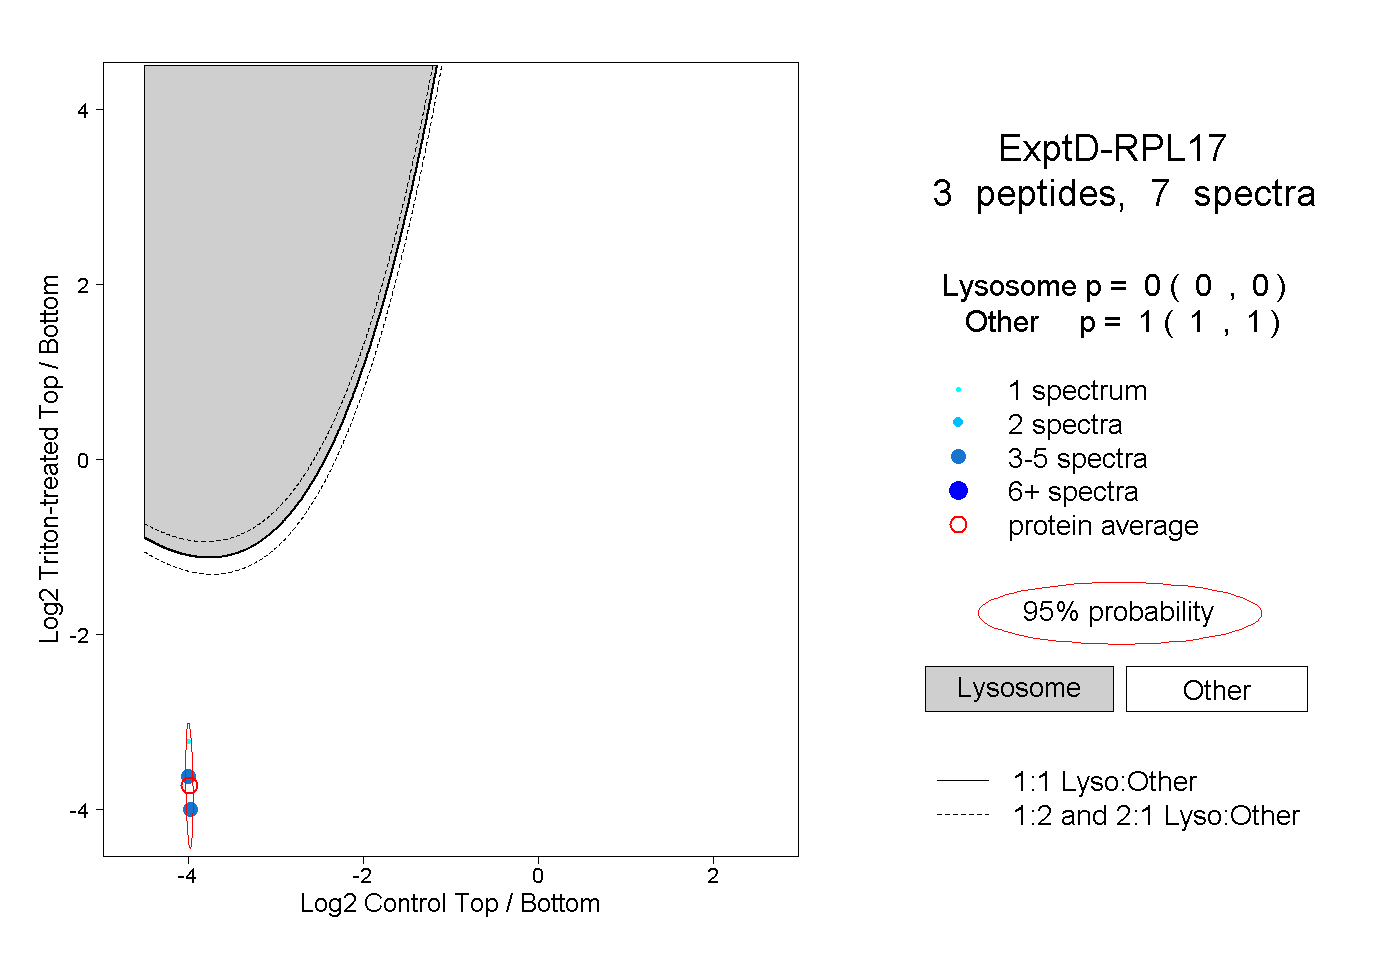 |
0.000 0.000 | 0.000 |
1.000 1.000 | 1.000 |