 1
1peptide
spectra
0.623 | 0.691
0.034 | 0.112
0.048 | 0.147
0.000 | 0.000
0.000 | 0.000
0.110 | 0.209
0.000 | 0.003
0.000 | 0.000
1peptide
spectrum
NA | NA
NA | NA
NA | NA
NA | NA
NA | NA
NA | NA
NA | NA
| Plot | Mito | Lyso | Perox | ER | Golgi | PM | Cytosol | Nucleus | |||||
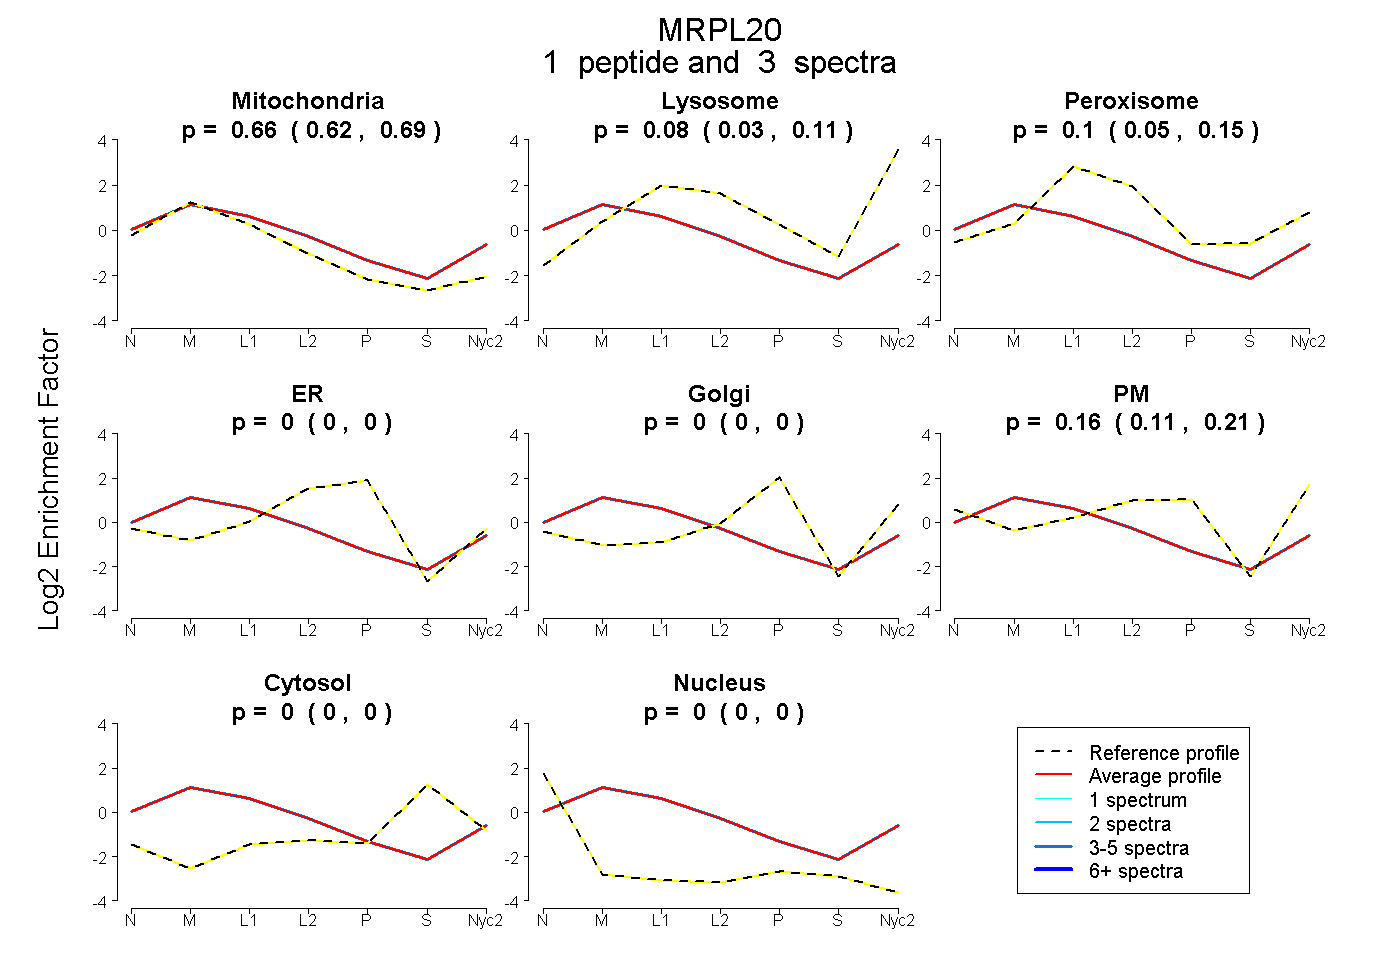
| Expt A |
1 peptide |
3 spectra |
|
0.660 0.623 | 0.691 |
0.077 0.034 | 0.112 |
0.101 0.048 | 0.147 |
0.000 0.000 | 0.000 |
0.000 0.000 | 0.000 |
0.162 0.110 | 0.209 |
0.000 0.000 | 0.003 |
0.000 0.000 | 0.000 |
||
| Plot | Mito | Lyso or Perox | ER | Golgi | PM | Cytosol | Nucleus | ||||||
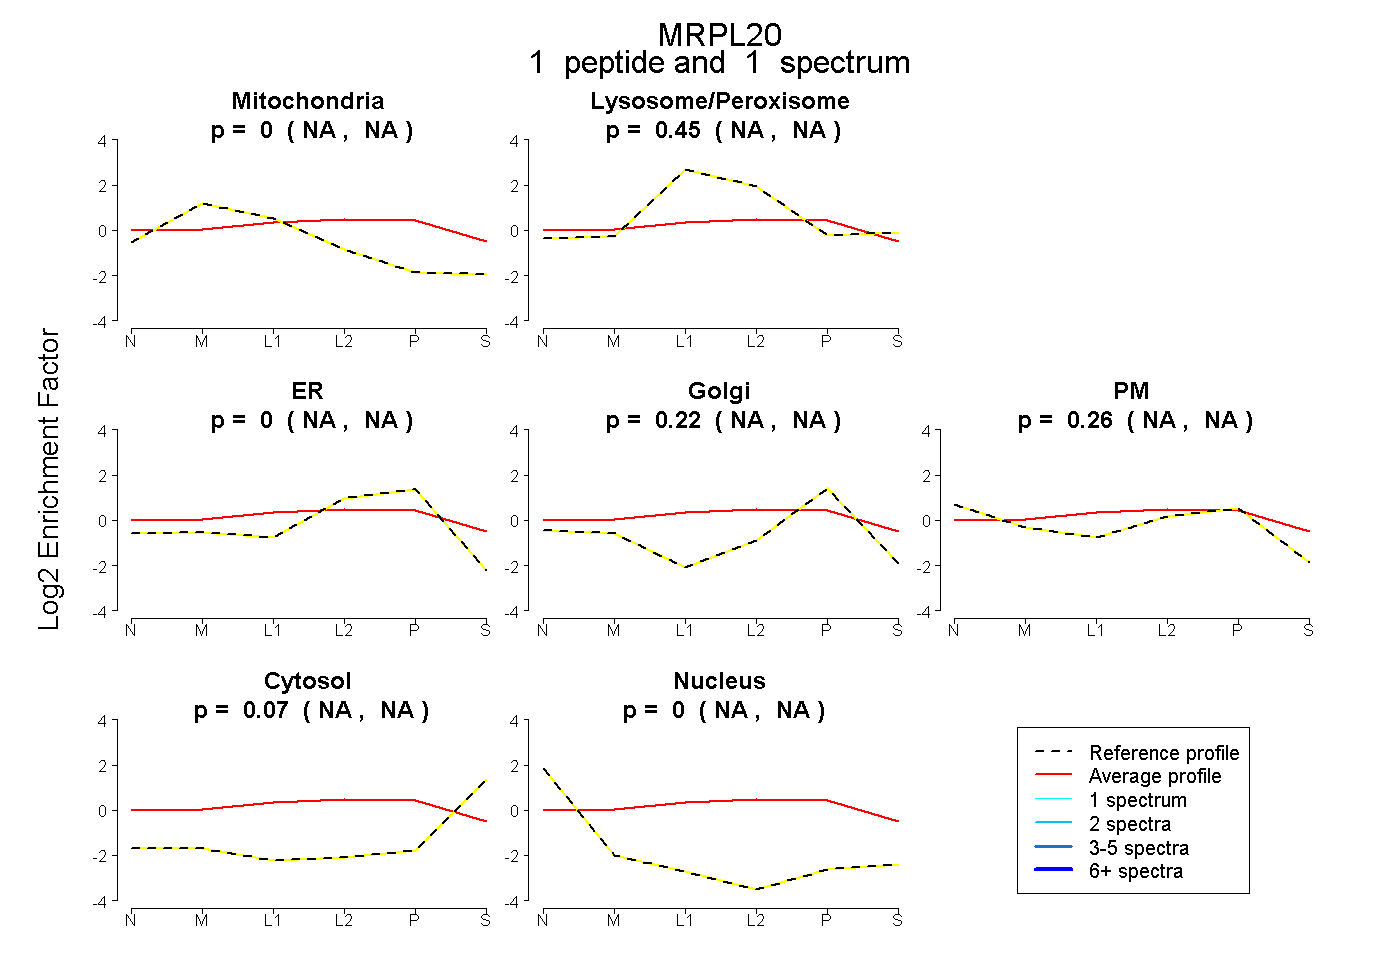
| Expt B |
1 peptide |
1 spectrum |
|
0.000 NA | NA |
0.449 NA | NA |
0.000 NA | NA |
0.220 NA | NA |
0.264 NA | NA |
0.067 NA | NA |
0.000 NA | NA |
| 1 spectrum, VLVDLAIYEPK | 0.000 | 0.449 | 0.000 | 0.220 | 0.264 | 0.067 | 0.000 |
| Plot | Lyso | Other | |||||||||||
| Expt C |
4 peptides |
19 spectra |
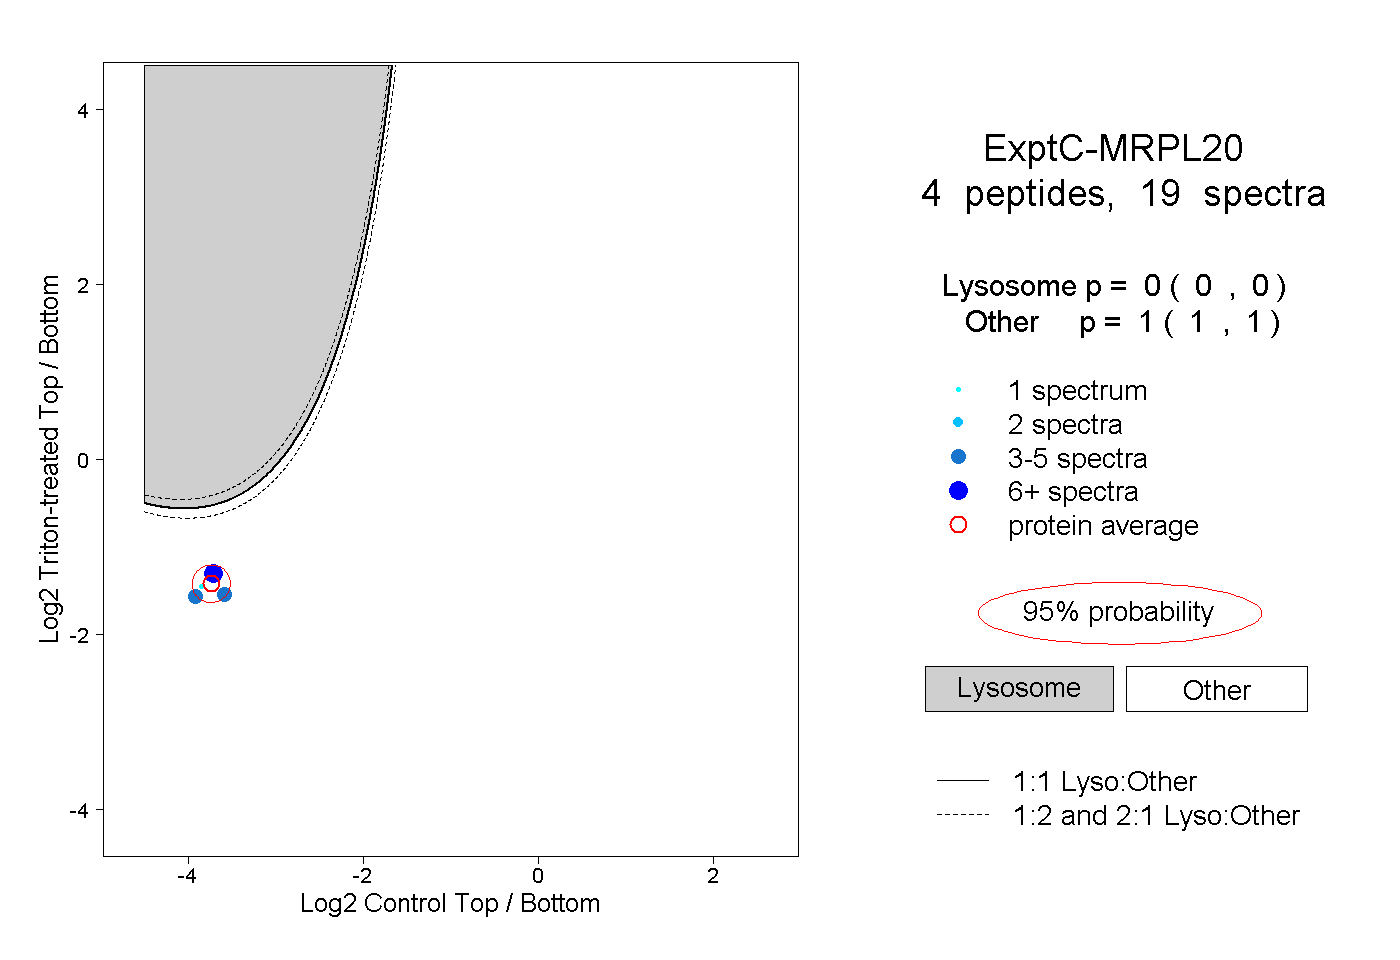 |
0.000 0.000 | 0.000 |
1.000 1.000 | 1.000 |