 1
1peptide
spectra
0.000 | 0.000
0.066 | 0.100
0.090 | 0.120
0.000 | 0.000
0.000 | 0.000
0.681 | 0.722
0.095 | 0.115
0.000 | 0.000
1peptide
spectra
0.000 | 0.000
1.000 | 1.000
| Plot | Mito | Lyso | Perox | ER | Golgi | PM | Cytosol | Nucleus | |||||
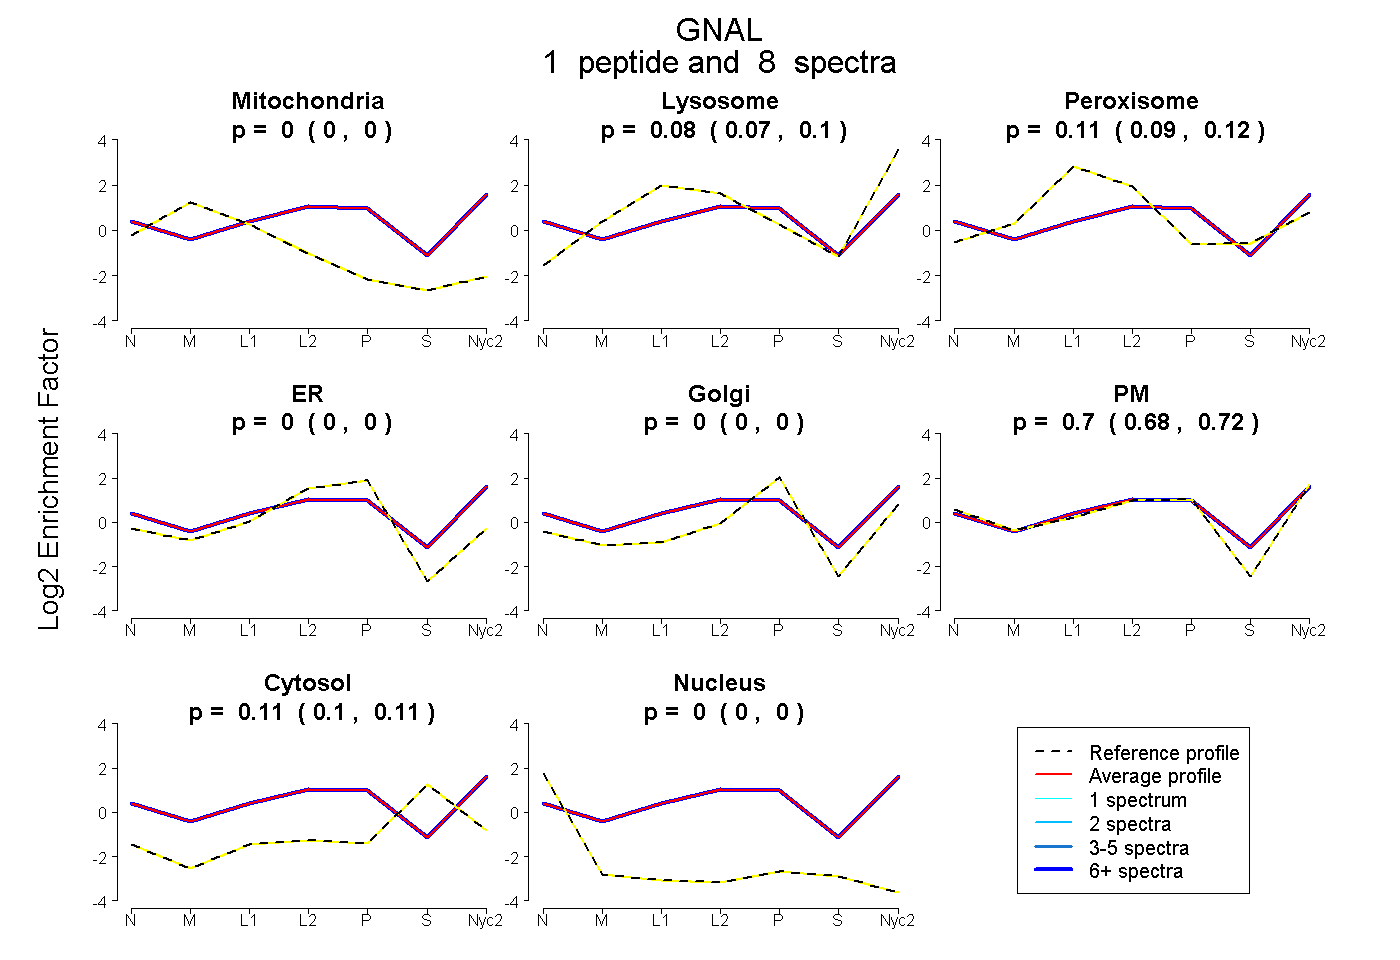
| Expt A |
1 peptide |
8 spectra |
|
0.000 0.000 | 0.000 |
0.084 0.066 | 0.100 |
0.106 0.090 | 0.120 |
0.000 0.000 | 0.000 |
0.000 0.000 | 0.000 |
0.704 0.681 | 0.722 |
0.106 0.095 | 0.115 |
0.000 0.000 | 0.000 |
||
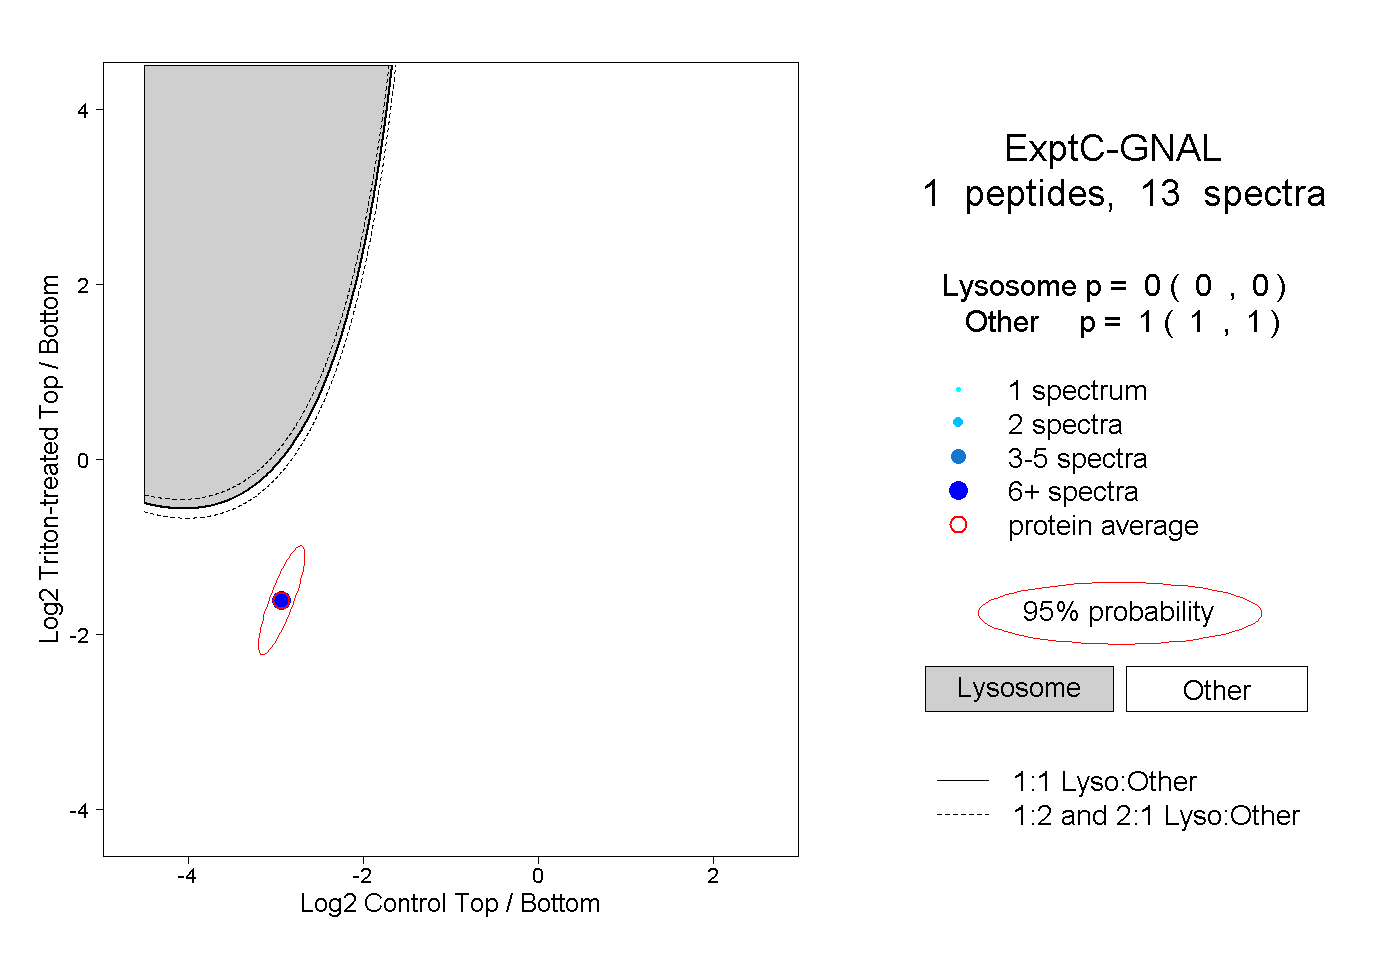
| Plot | Lyso | Other | |||||||||||
| Expt C |
1 peptide |
13 spectra |
|
0.000 0.000 | 0.000 |
1.000 1.000 | 1.000 |