 3
3peptides
spectra
0.000 | 0.123
0.036 | 0.188
0.000 | 0.021
0.000 | 0.000
0.000 | 0.000
0.000 | 0.000
0.736 | 0.907
0.000 | 0.036
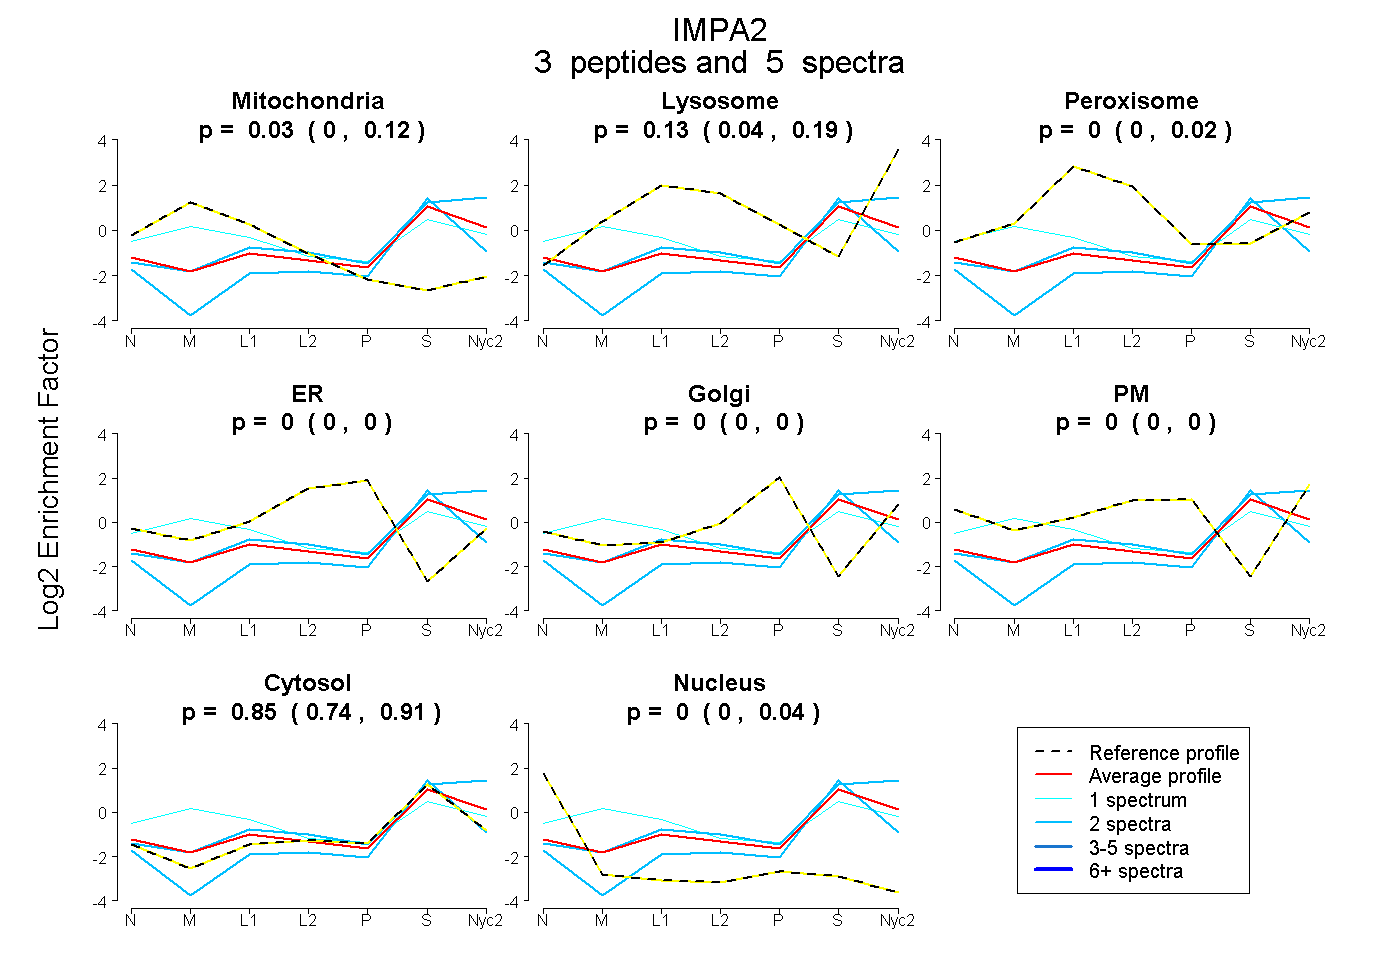
| Plot | Mito | Lyso | Perox | ER | Golgi | PM | Cytosol | Nucleus | |||||
| Expt A |
3 peptides |
5 spectra |
|
0.028 0.000 | 0.123 |
0.126 0.036 | 0.188 |
0.000 0.000 | 0.021 |
0.000 0.000 | 0.000 |
0.000 0.000 | 0.000 |
0.000 0.000 | 0.000 |
0.846 0.736 | 0.907 |
0.000 0.000 | 0.036 |