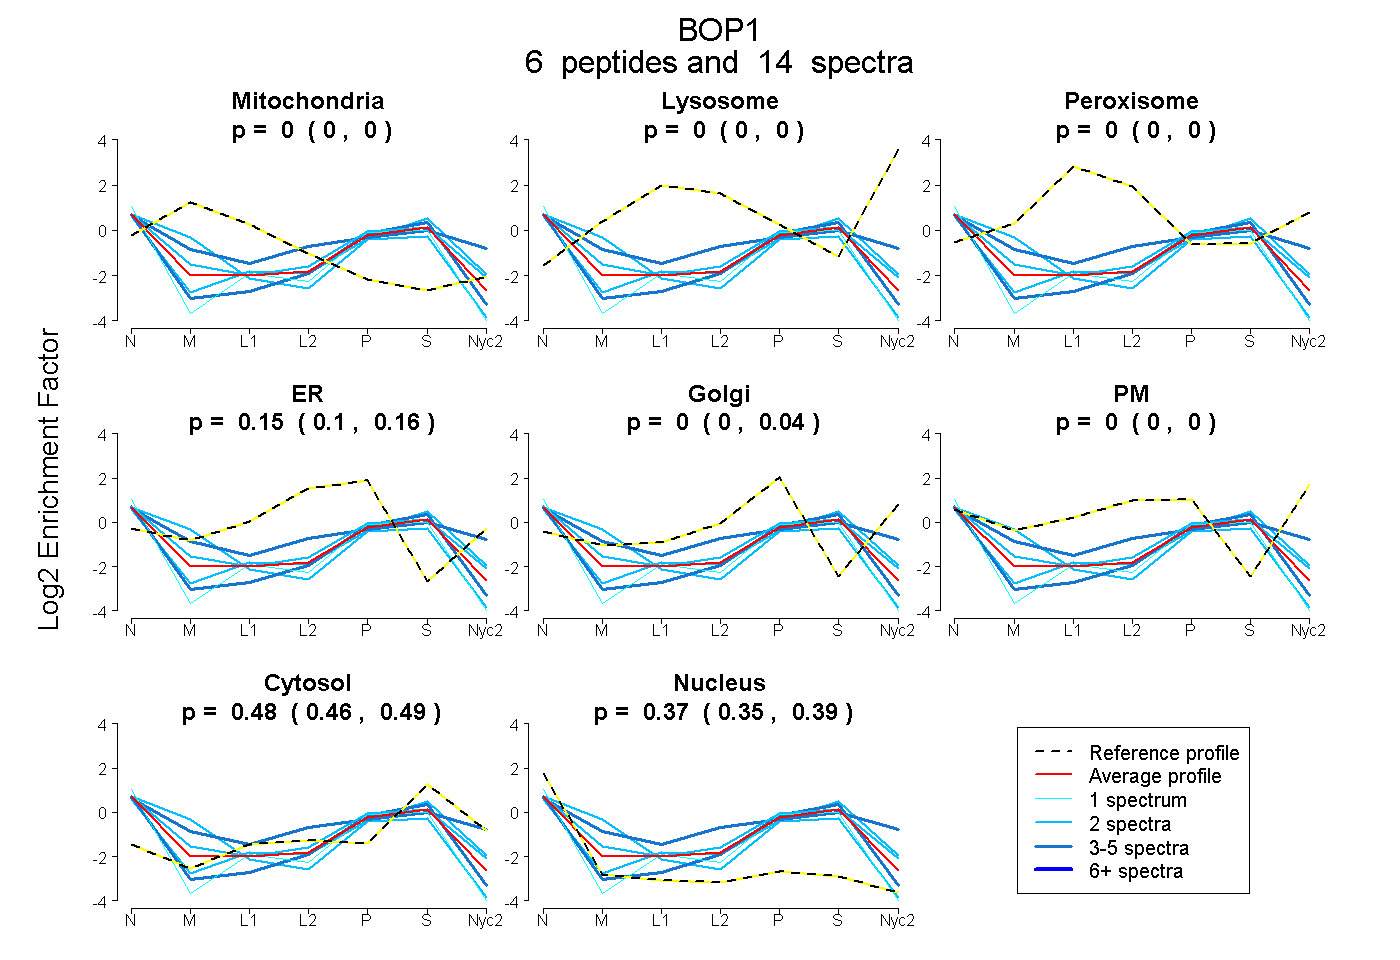
 6
6peptides
spectra
0.000 | 0.000
0.000 | 0.000
0.000 | 0.000
0.101 | 0.161
0.000 | 0.044
0.000 | 0.000
0.463 | 0.493
0.351 | 0.390
| Plot | Mito | Lyso | Perox | ER | Golgi | PM | Cytosol | Nucleus | |||||
| Expt A |
6 peptides |
14 spectra |
|
0.000 0.000 | 0.000 |
0.000 0.000 | 0.000 |
0.000 0.000 | 0.000 |
0.147 0.101 | 0.161 |
0.000 0.000 | 0.044 |
0.000 0.000 | 0.000 |
0.480 0.463 | 0.493 |
0.373 0.351 | 0.390 |
| 4 spectra, LTDEQVALVHR | 0.055 | 0.000 | 0.000 | 0.000 | 0.000 | 0.344 | 0.451 | 0.150 | ||
| 2 spectra, TVPAYGR | 0.000 | 0.000 | 0.000 | 0.116 | 0.117 | 0.000 | 0.462 | 0.305 | ||
| 3 spectra, IYHLLR | 0.000 | 0.000 | 0.000 | 0.036 | 0.000 | 0.000 | 0.521 | 0.443 | ||
| 2 spectra, AVAFHPR | 0.266 | 0.000 | 0.000 | 0.013 | 0.000 | 0.000 | 0.303 | 0.418 | ||
| 1 spectrum, VNVDPEDLIPK | 0.000 | 0.000 | 0.000 | 0.040 | 0.000 | 0.000 | 0.422 | 0.537 | ||
| 2 spectra, AEEAGALTR | 0.000 | 0.000 | 0.000 | 0.000 | 0.105 | 0.000 | 0.604 | 0.291 |
| Plot | Mito | Lyso or Perox | ER | Golgi | PM | Cytosol | Nucleus | ||||||
| Expt B |
2 peptides |
6 spectra |
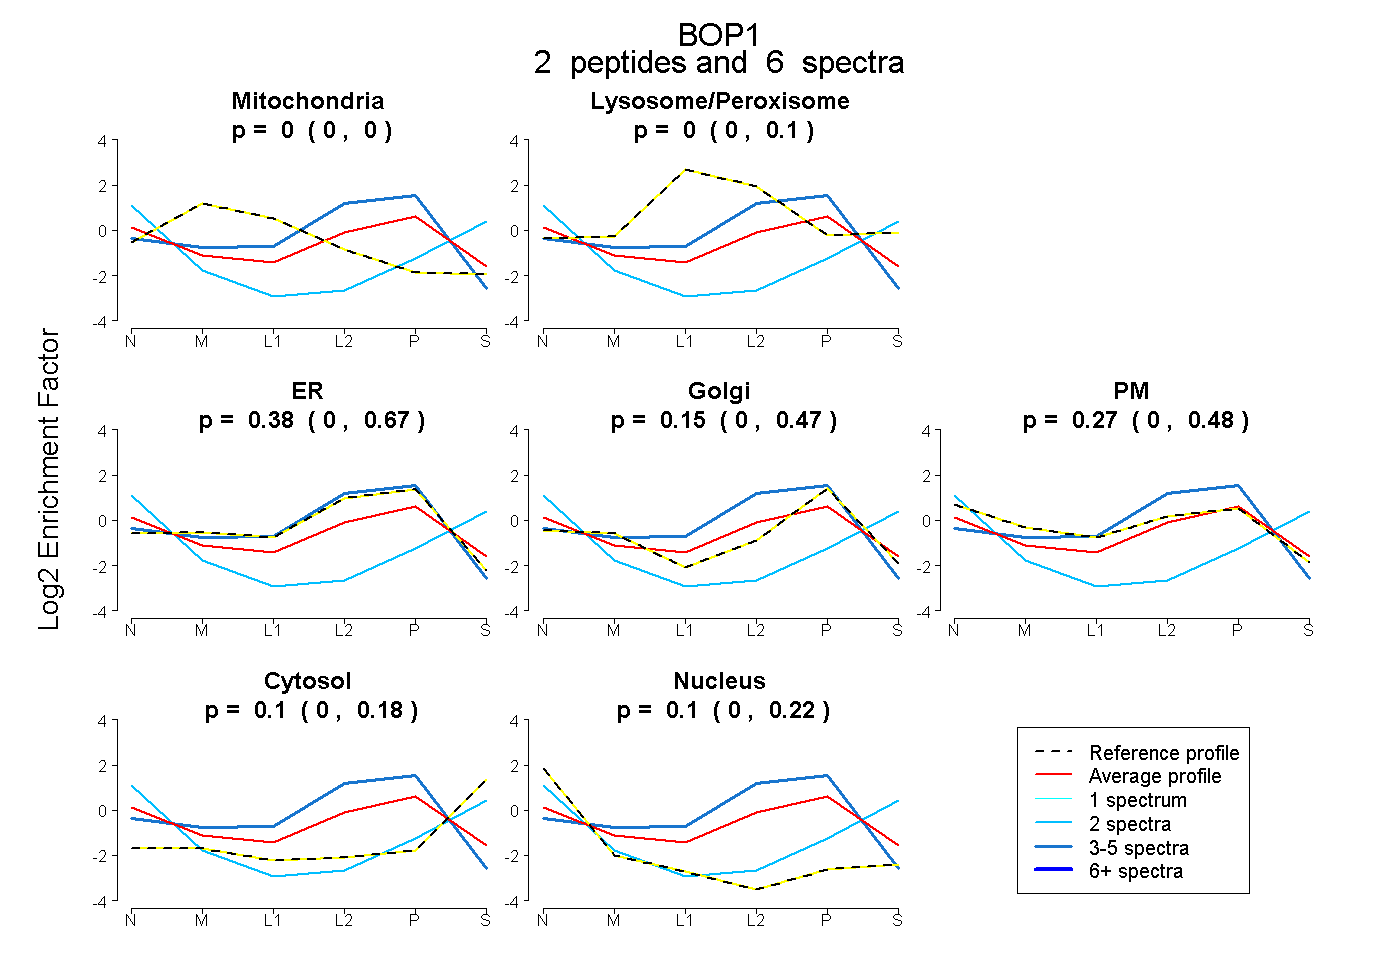 |
0.000 0.000 | 0.000 |
0.000 0.000 | 0.100 |
0.383 0.000 | 0.671 |
0.147 0.000 | 0.469 |
0.275 0.000 | 0.481 |
0.098 0.000 | 0.175 |
0.096 0.000 | 0.219 |