 6
6peptides
spectra
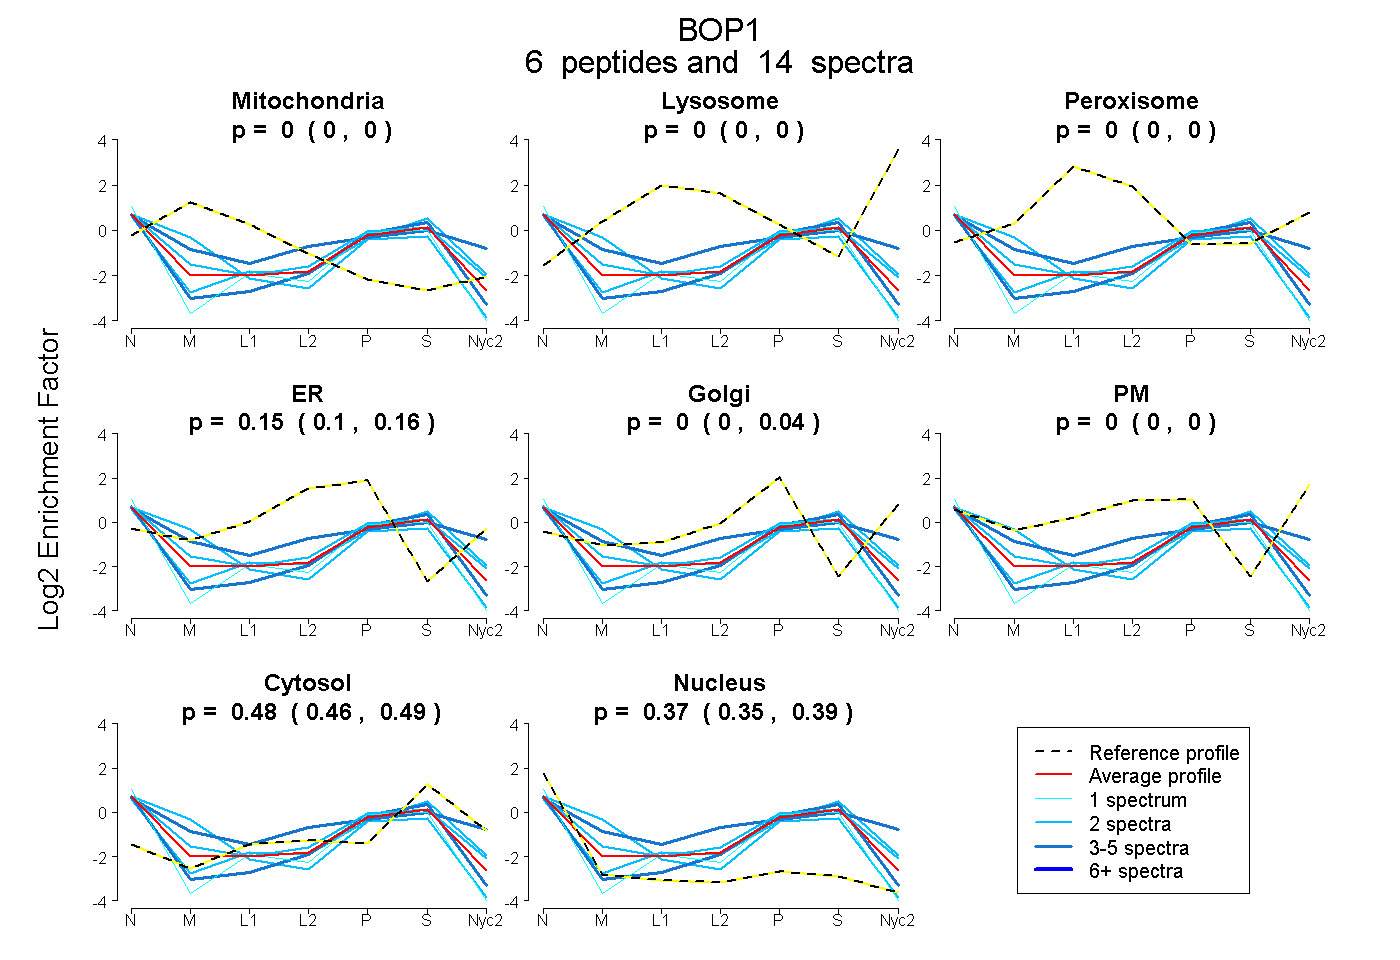
0.000 | 0.000
0.000 | 0.000
0.000 | 0.000
0.101 | 0.161
0.000 | 0.044
0.000 | 0.000
0.463 | 0.493
0.351 | 0.390
2peptides
spectra
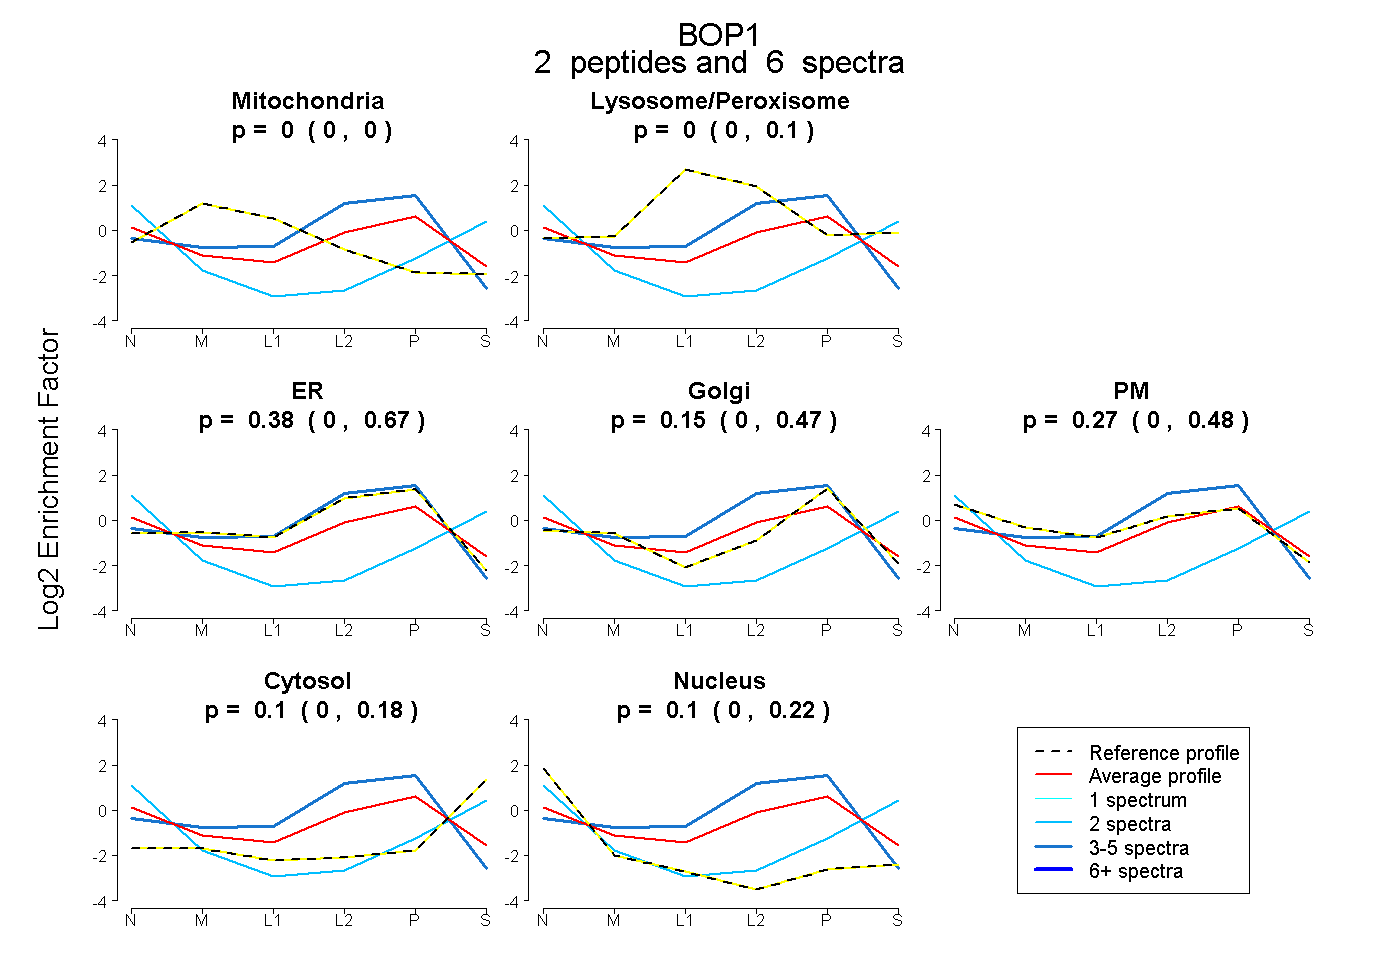
0.000 | 0.000
0.000 | 0.100
0.000 | 0.671
0.000 | 0.469
0.000 | 0.481
0.000 | 0.175
0.000 | 0.219