 11
11peptides
spectra
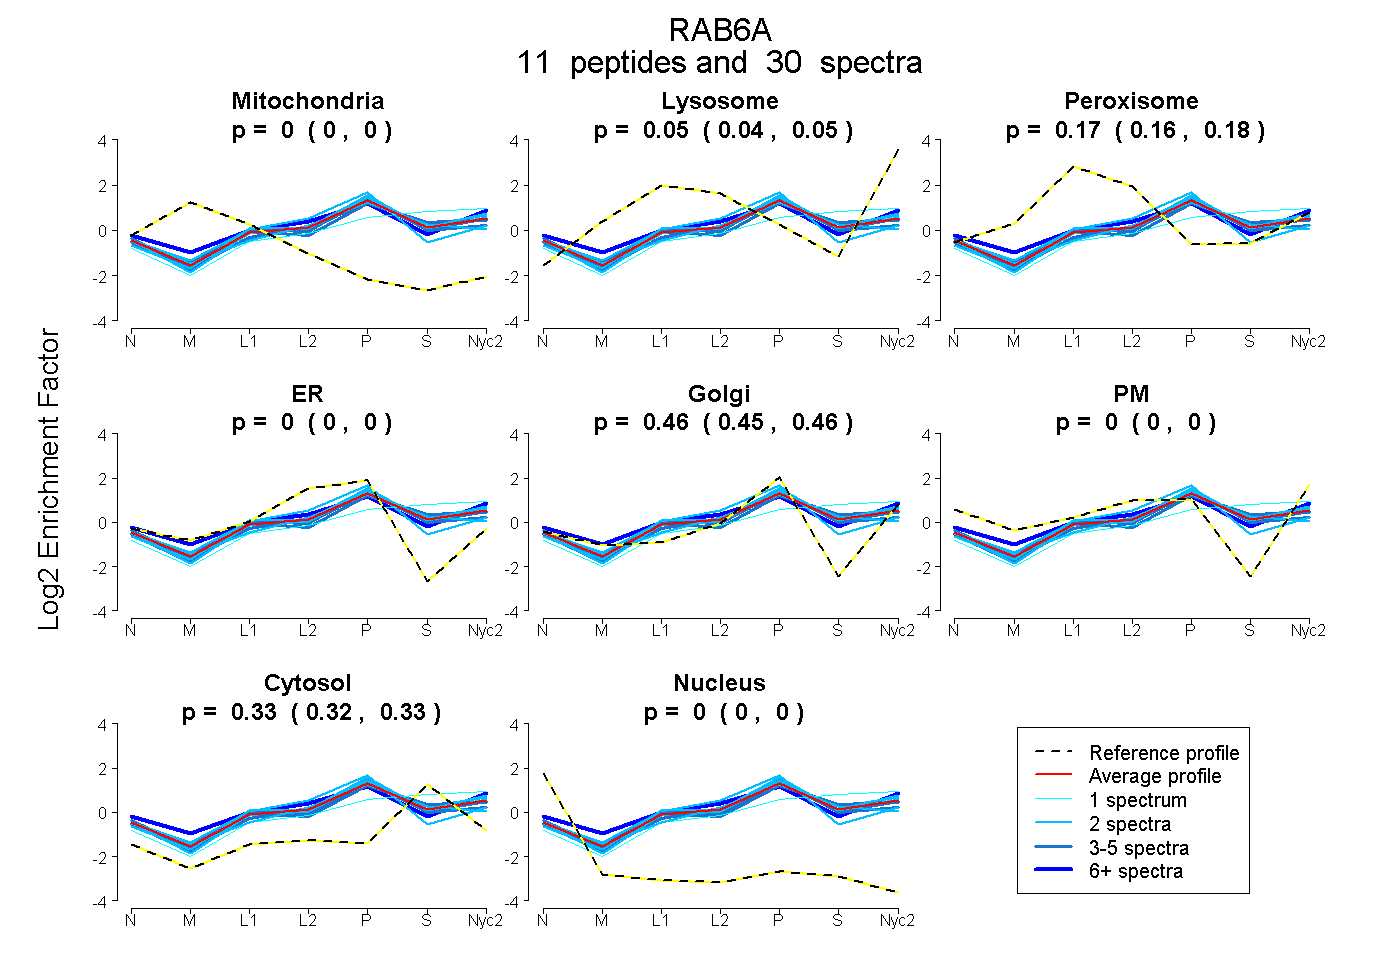
0.000 | 0.000
0.036 | 0.054
0.158 | 0.175
0.000 | 0.000
0.452 | 0.465
0.000 | 0.000
0.322 | 0.331
0.000 | 0.000
5peptides
spectra
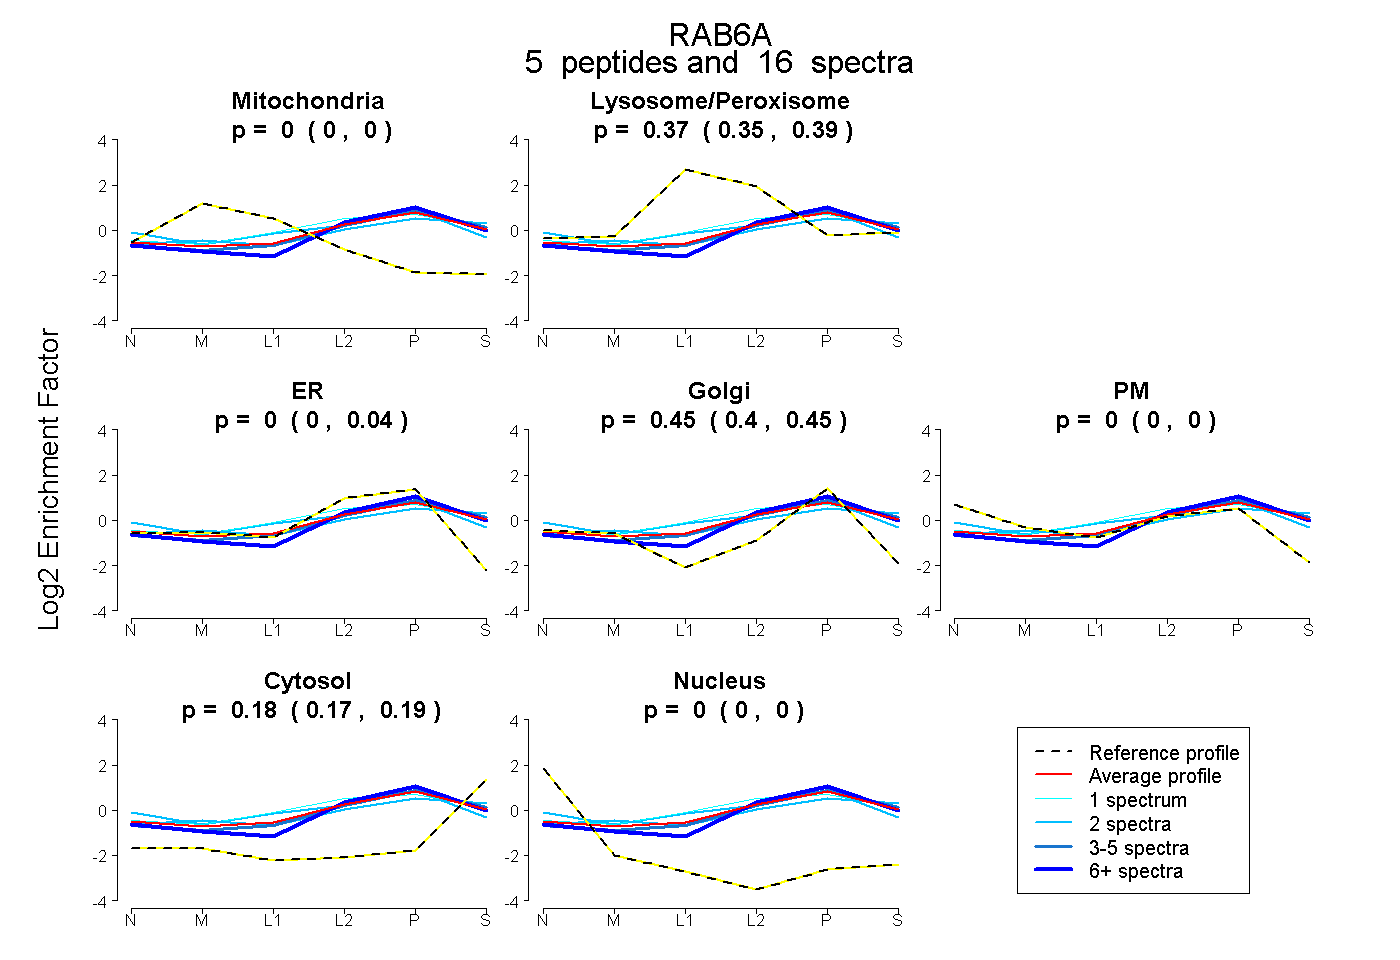
0.000 | 0.000
0.347 | 0.386
0.000 | 0.044
0.400 | 0.454
0.000 | 0.000
0.169 | 0.193
0.000 | 0.000
12peptides
spectra
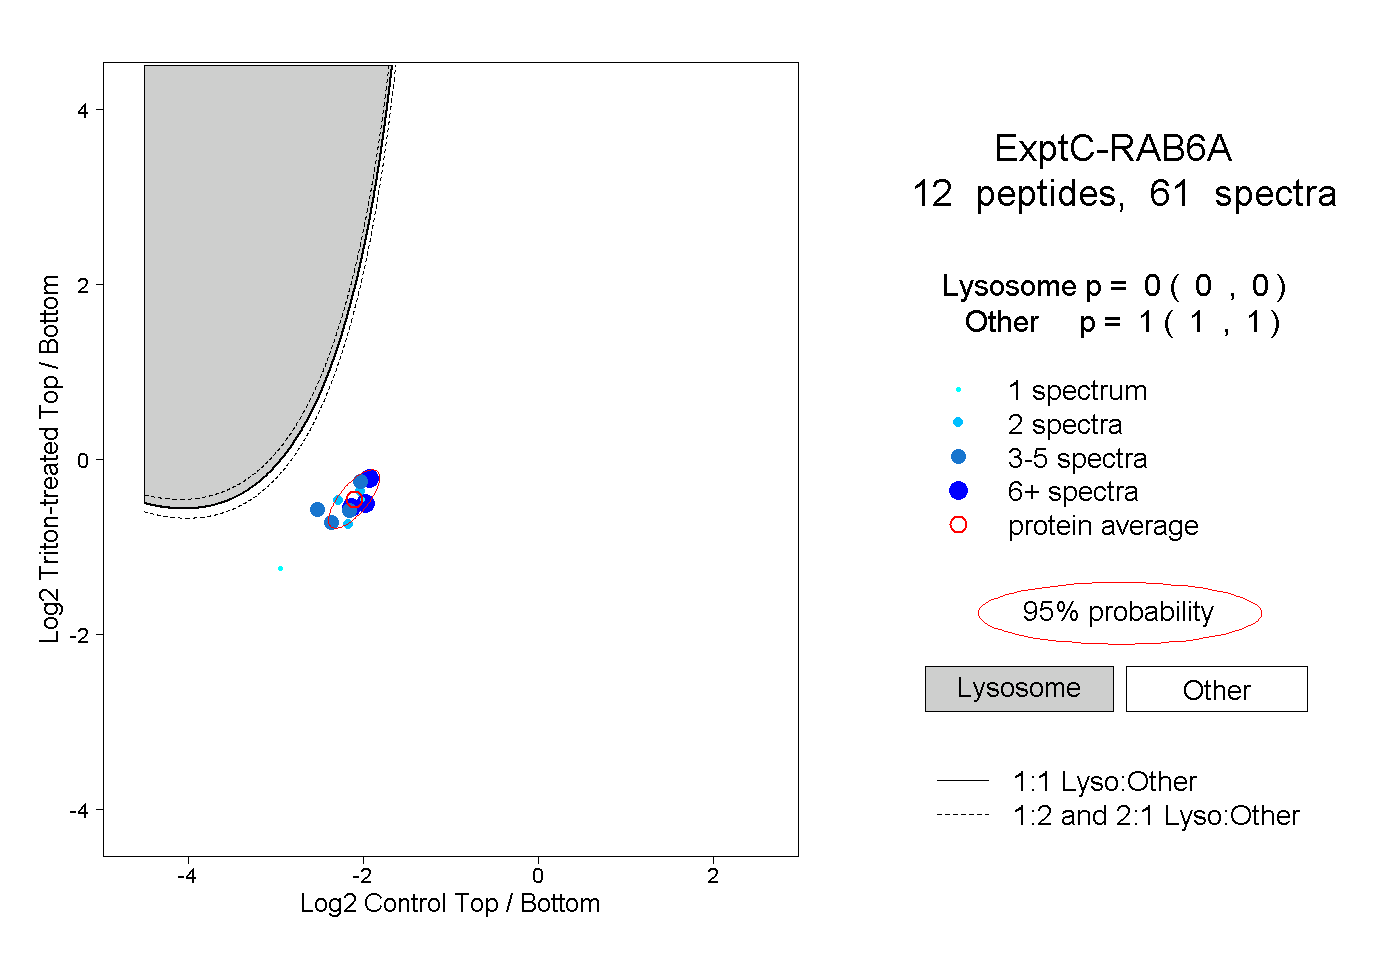
0.000 | 0.000
1.000 | 1.000
3peptides
spectra
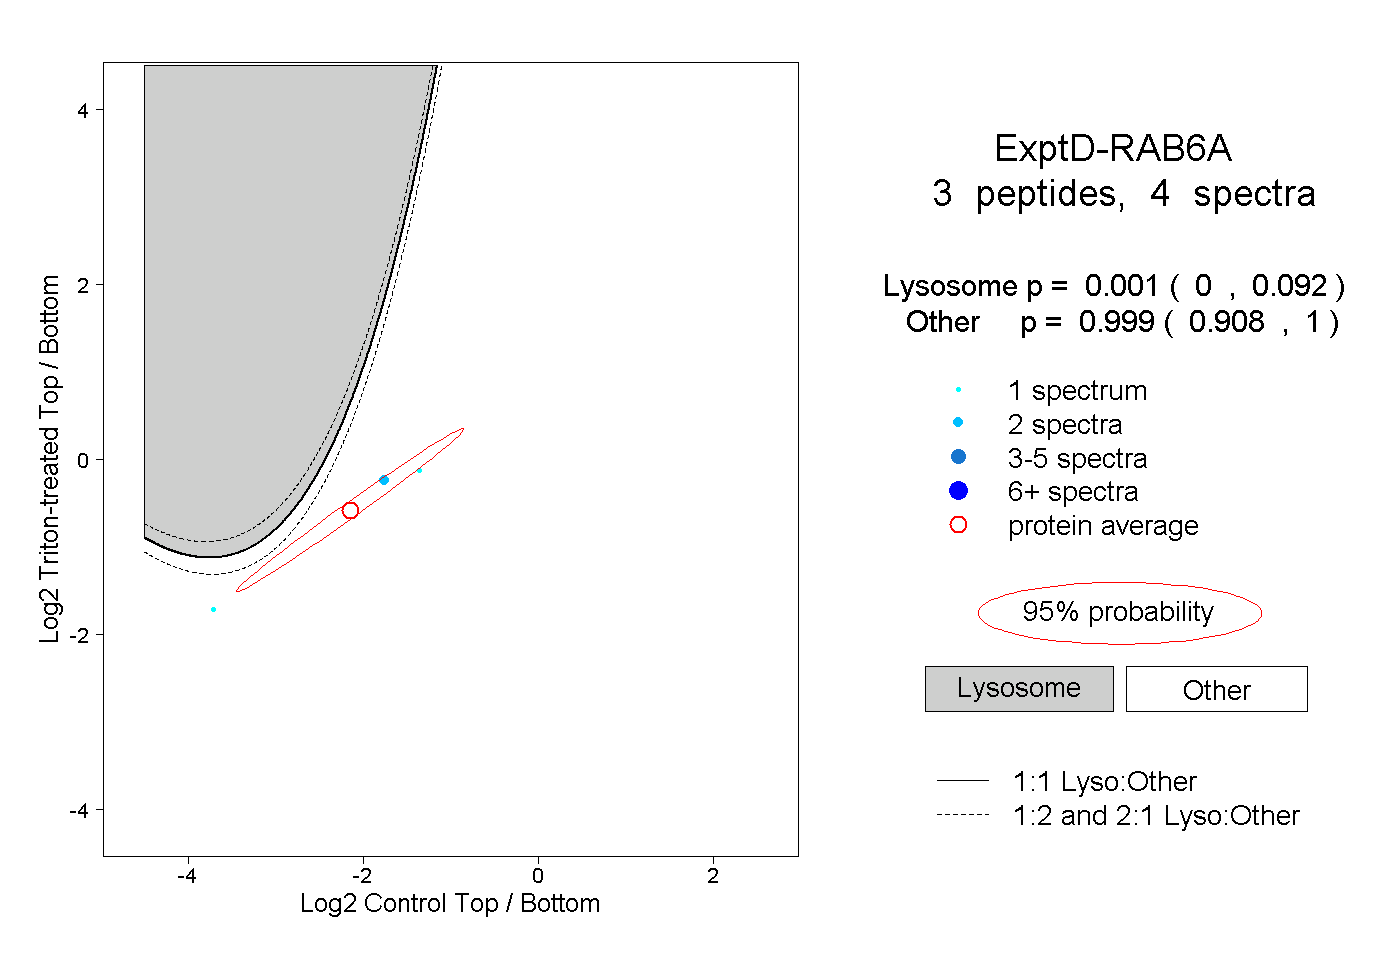
0.000 | 0.092
0.908 | 1.000