 11
11peptides
spectra
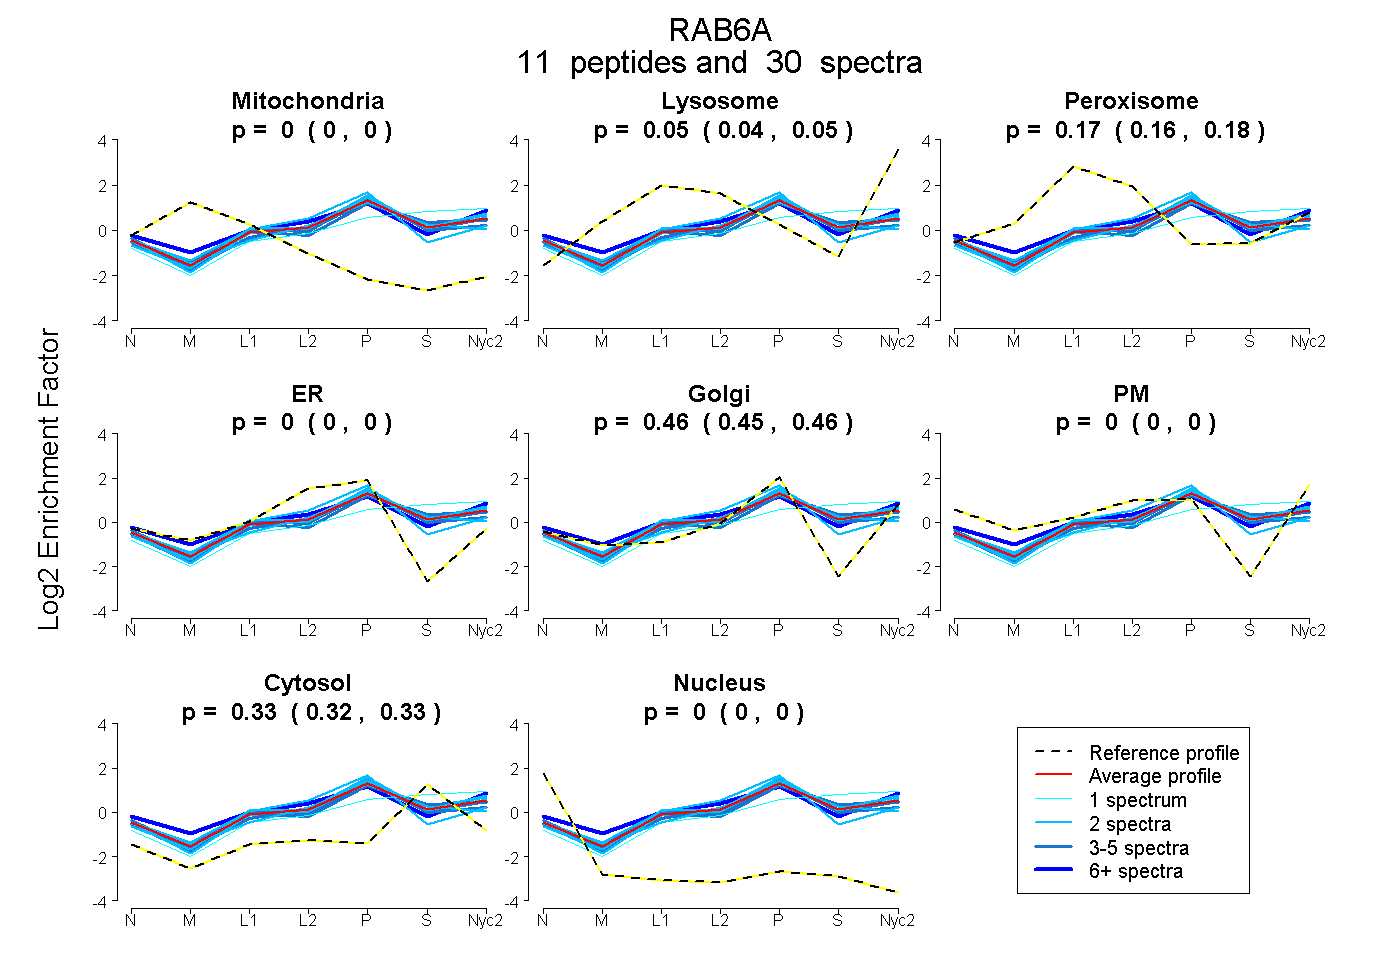
0.000 | 0.000
0.036 | 0.054
0.158 | 0.175
0.000 | 0.000
0.452 | 0.465
0.000 | 0.000
0.322 | 0.331
0.000 | 0.000
| Plot | Mito | Lyso | Perox | ER | Golgi | PM | Cytosol | Nucleus | |||||
| Expt A |
11 peptides |
30 spectra |
|
0.000 0.000 | 0.000 |
0.046 0.036 | 0.054 |
0.168 0.158 | 0.175 |
0.000 0.000 | 0.000 |
0.459 0.452 | 0.465 |
0.000 0.000 | 0.000 |
0.327 0.322 | 0.331 |
0.000 0.000 | 0.000 |
| 2 spectra, GSDVIIMLVGNK | 0.000 | 0.004 | 0.153 | 0.276 | 0.342 | 0.000 | 0.226 | 0.000 | ||
| 2 spectra, WIDDVR | 0.000 | 0.115 | 0.083 | 0.013 | 0.448 | 0.000 | 0.341 | 0.000 | ||
| 1 spectrum, TSILTR | 0.000 | 0.239 | 0.000 | 0.000 | 0.213 | 0.000 | 0.547 | 0.000 | ||
| 2 spectra, LVFLGEQSVGK | 0.000 | 0.109 | 0.104 | 0.000 | 0.431 | 0.000 | 0.357 | 0.000 | ||
| 4 spectra, QVSIEEGER | 0.000 | 0.106 | 0.076 | 0.083 | 0.334 | 0.000 | 0.402 | 0.000 | ||
| 2 spectra, VAAALPGMESTQDR | 0.000 | 0.016 | 0.101 | 0.199 | 0.280 | 0.000 | 0.403 | 0.000 | ||
| 3 spectra, SLIPSYIR | 0.000 | 0.053 | 0.138 | 0.000 | 0.405 | 0.000 | 0.404 | 0.000 | ||
| 3 spectra, EDMIDIK | 0.000 | 0.000 | 0.195 | 0.011 | 0.490 | 0.000 | 0.304 | 0.000 | ||
| 2 spectra, TMYLEDR | 0.000 | 0.093 | 0.122 | 0.034 | 0.436 | 0.000 | 0.316 | 0.000 | ||
| 6 spectra, AGYNVK | 0.000 | 0.085 | 0.173 | 0.000 | 0.380 | 0.111 | 0.250 | 0.000 | ||
| 3 spectra, ELNVMFIETSAK | 0.000 | 0.022 | 0.175 | 0.000 | 0.484 | 0.000 | 0.320 | 0.000 |
| Plot | Mito | Lyso or Perox | ER | Golgi | PM | Cytosol | Nucleus | ||||||
| Expt B |
5 peptides |
16 spectra |
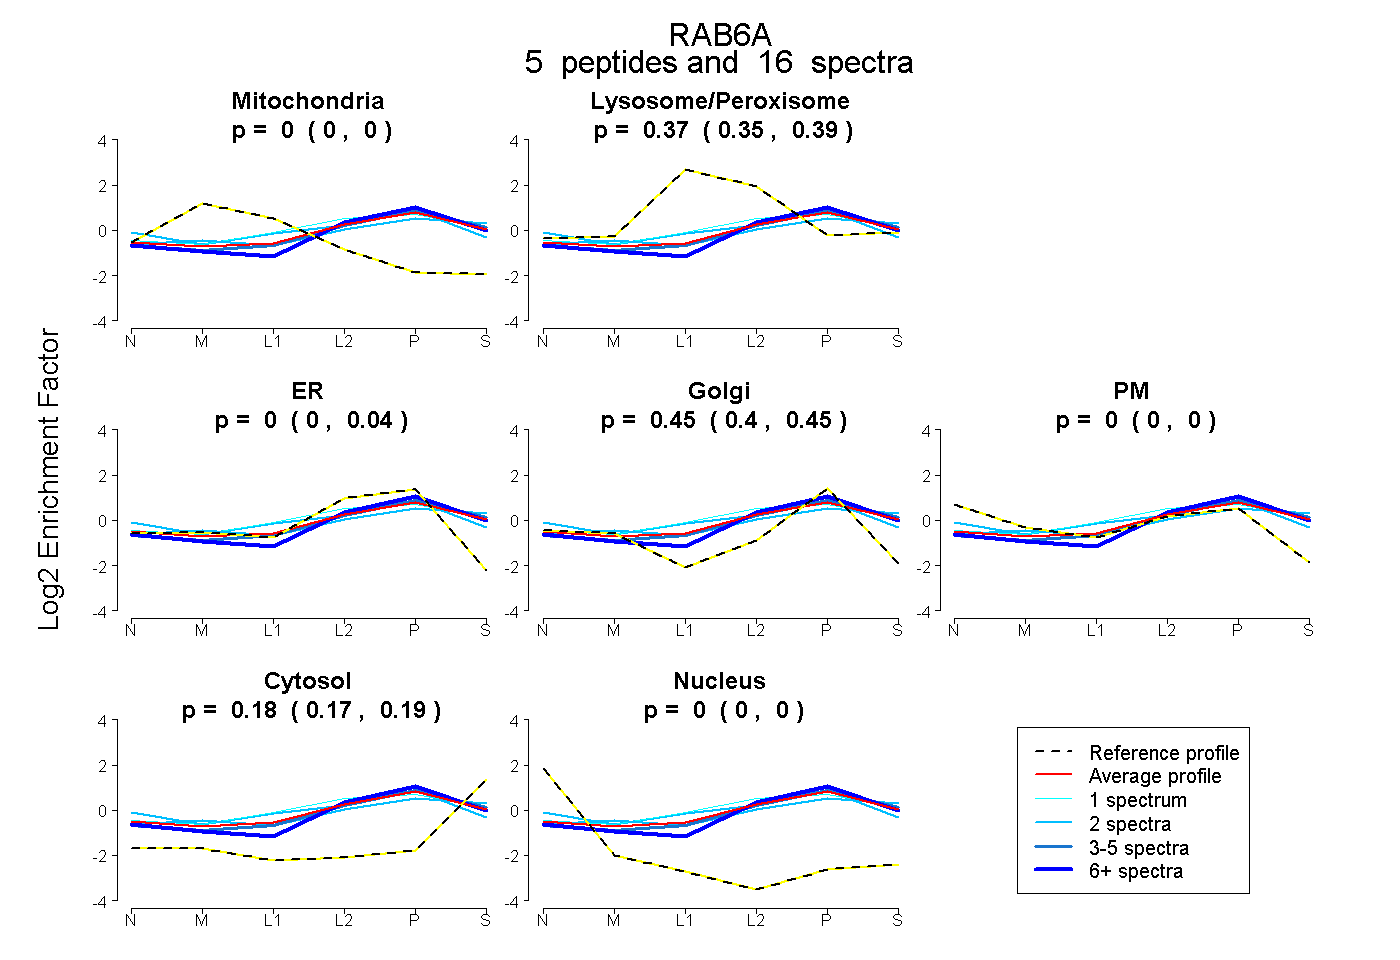 |
0.000 0.000 | 0.000 |
0.374 0.347 | 0.386 |
0.000 0.000 | 0.044 |
0.447 0.400 | 0.454 |
0.000 0.000 | 0.000 |
0.179 0.169 | 0.193 |
0.000 0.000 | 0.000 |
|||
| Plot | Lyso | Other | |||||||||||
| Expt C |
12 peptides |
61 spectra |
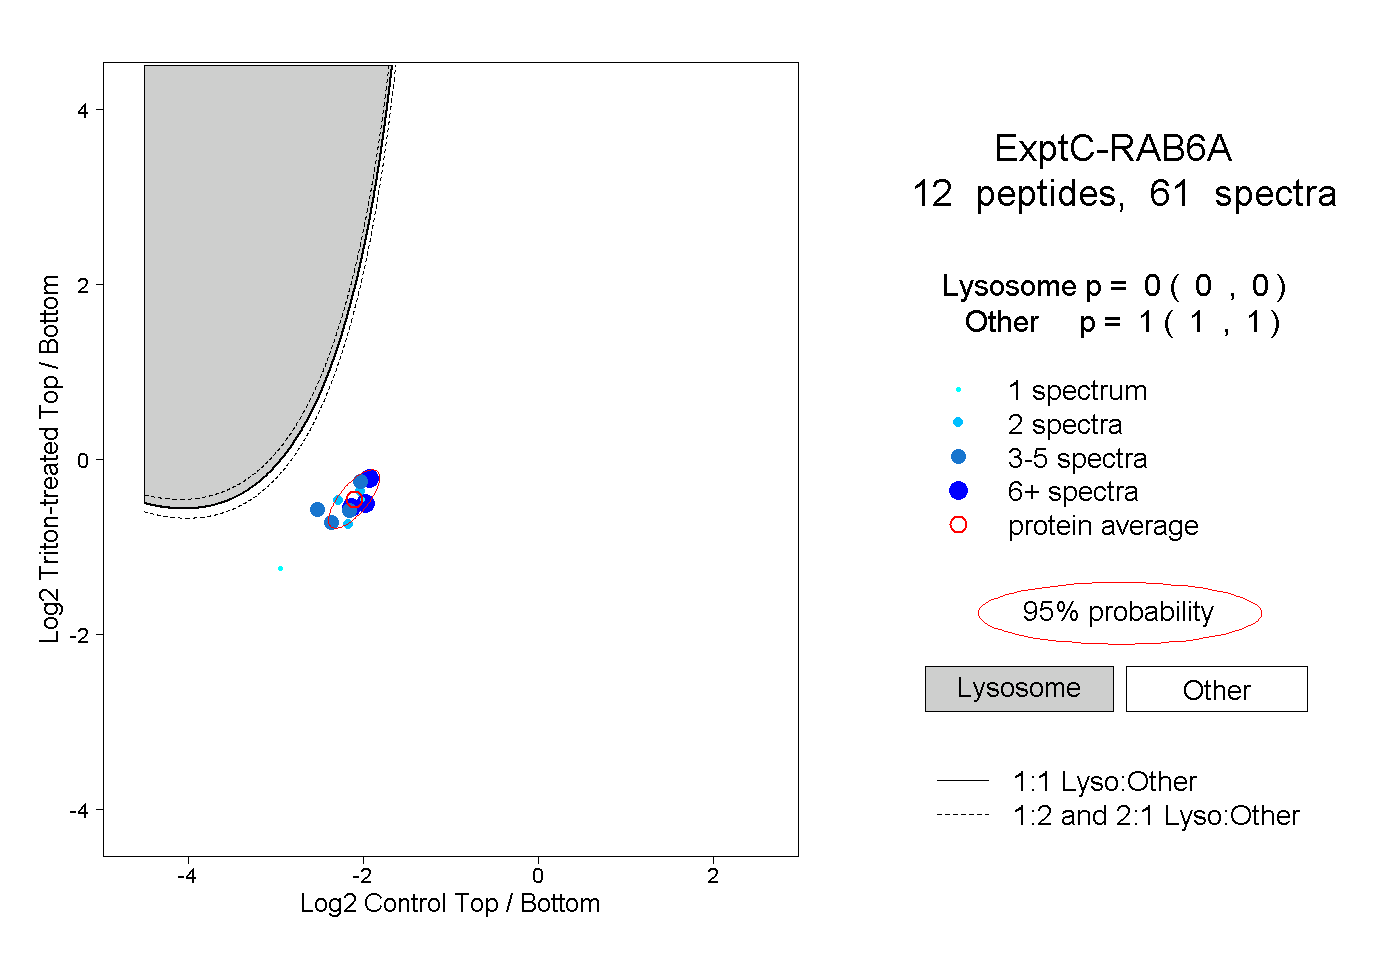 |
0.000 0.000 | 0.000 |
1.000 1.000 | 1.000 |
||||||||
| Plot | Lyso | Other | |||||||||||
| Expt D |
3 peptides |
4 spectra |
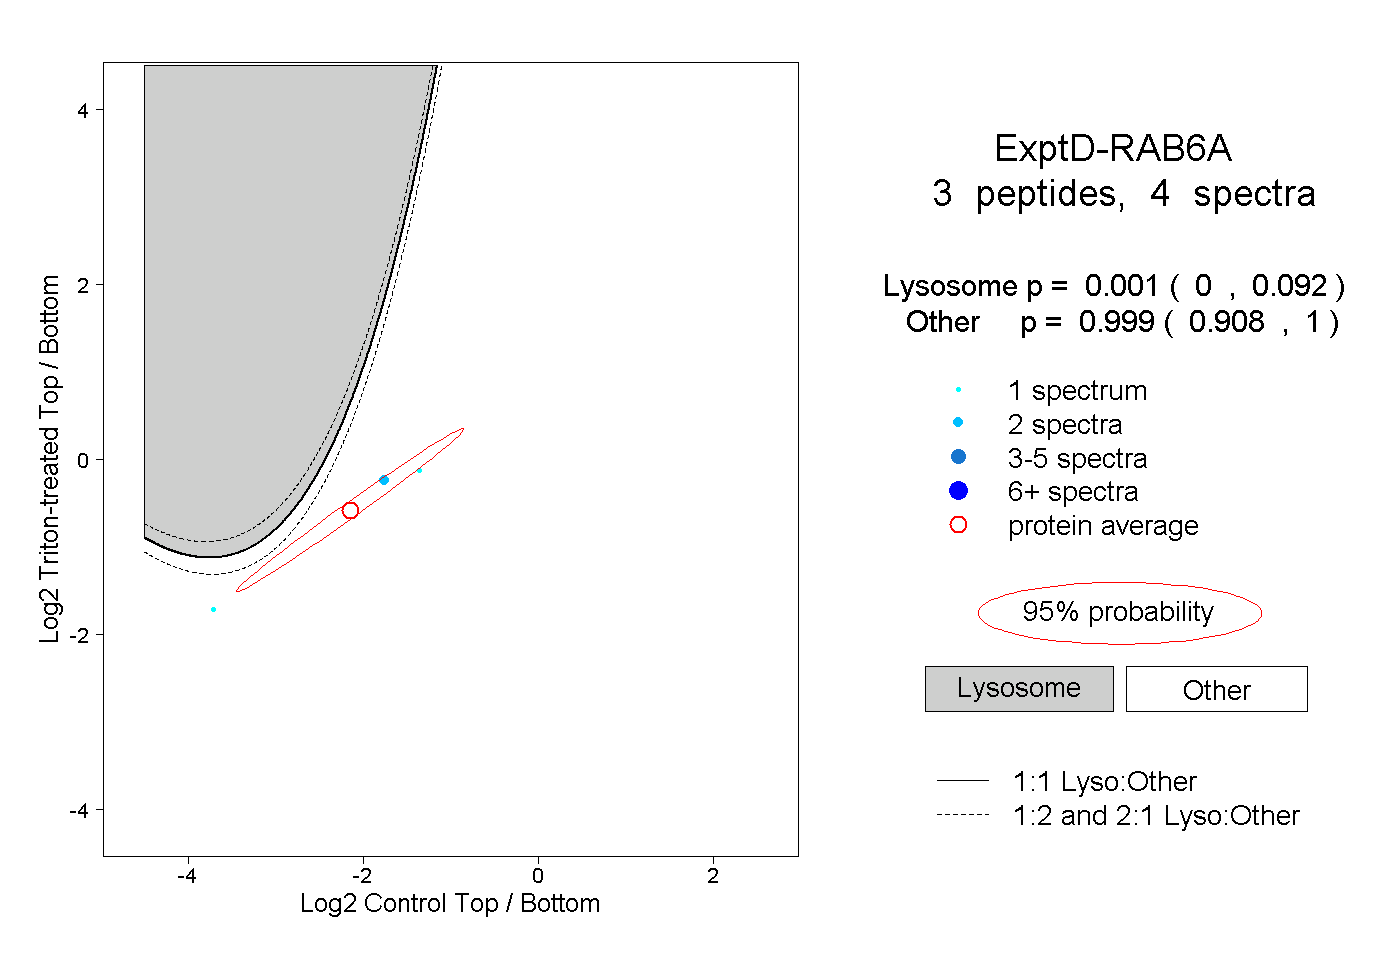 |
0.001 0.000 | 0.092 |
0.999 0.908 | 1.000 |