 3
3peptides
spectra
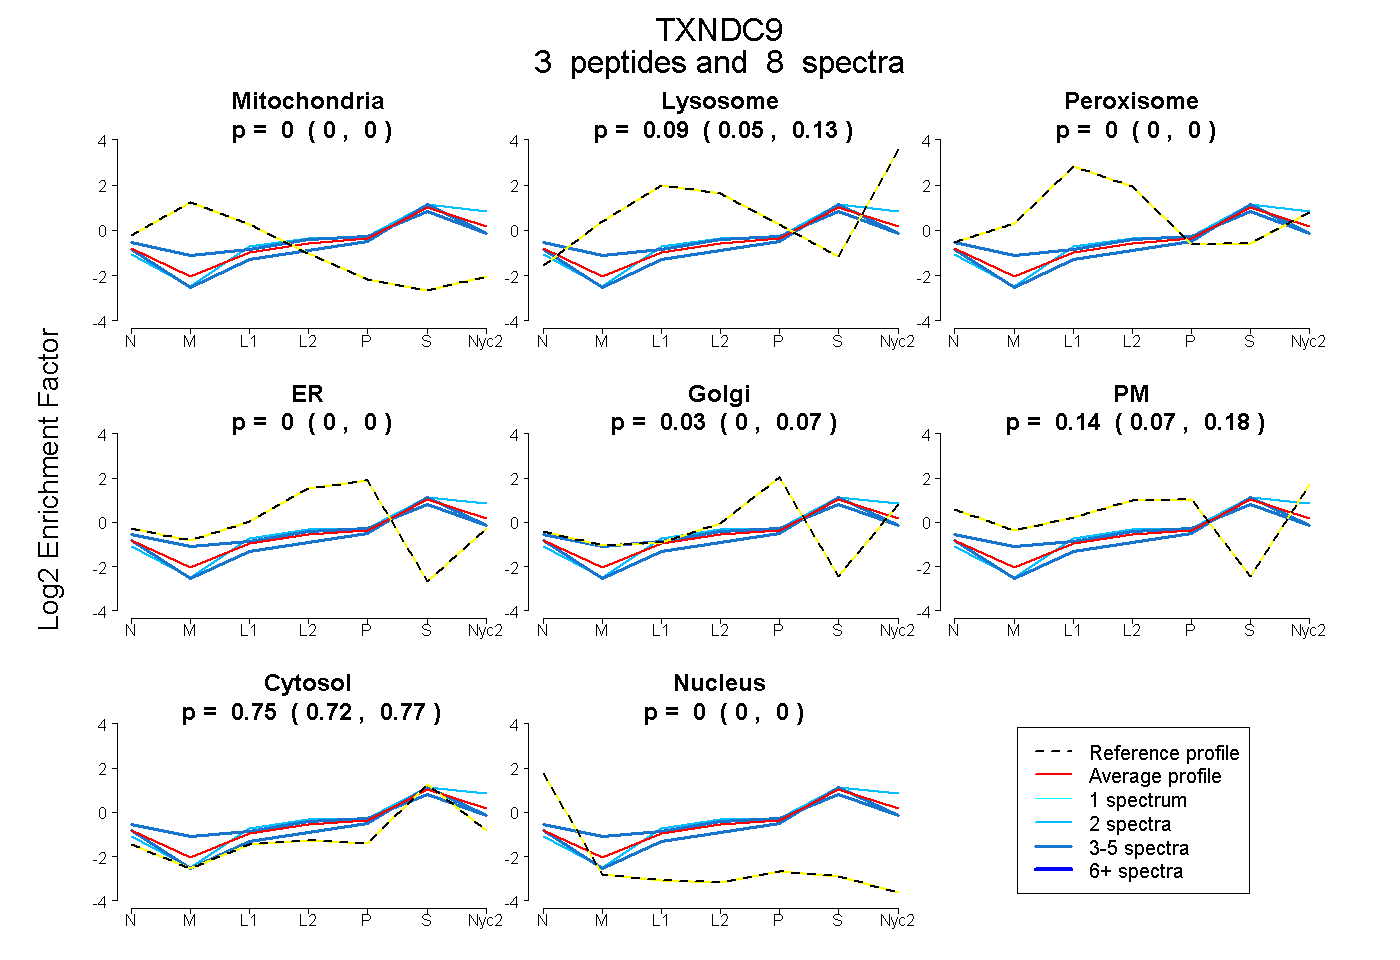
0.000 | 0.000
0.049 | 0.131
0.000 | 0.003
0.000 | 0.000
0.000 | 0.070
0.067 | 0.178
0.721 | 0.765
0.000 | 0.000
1peptide
spectrum
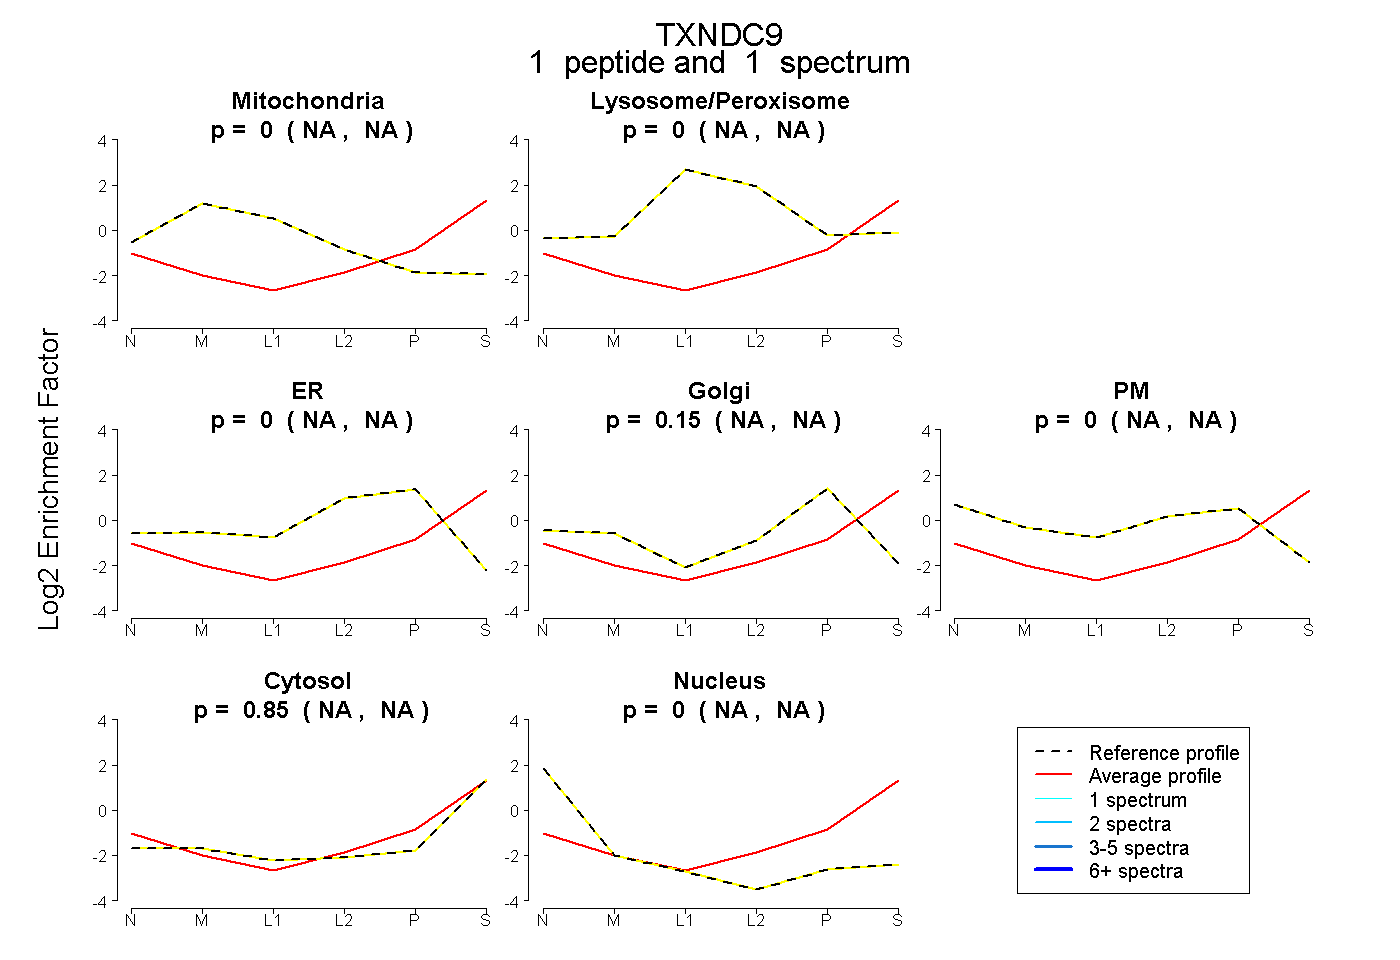
NA | NA
NA | NA
NA | NA
NA | NA
NA | NA
NA | NA
NA | NA
1peptide
spectra
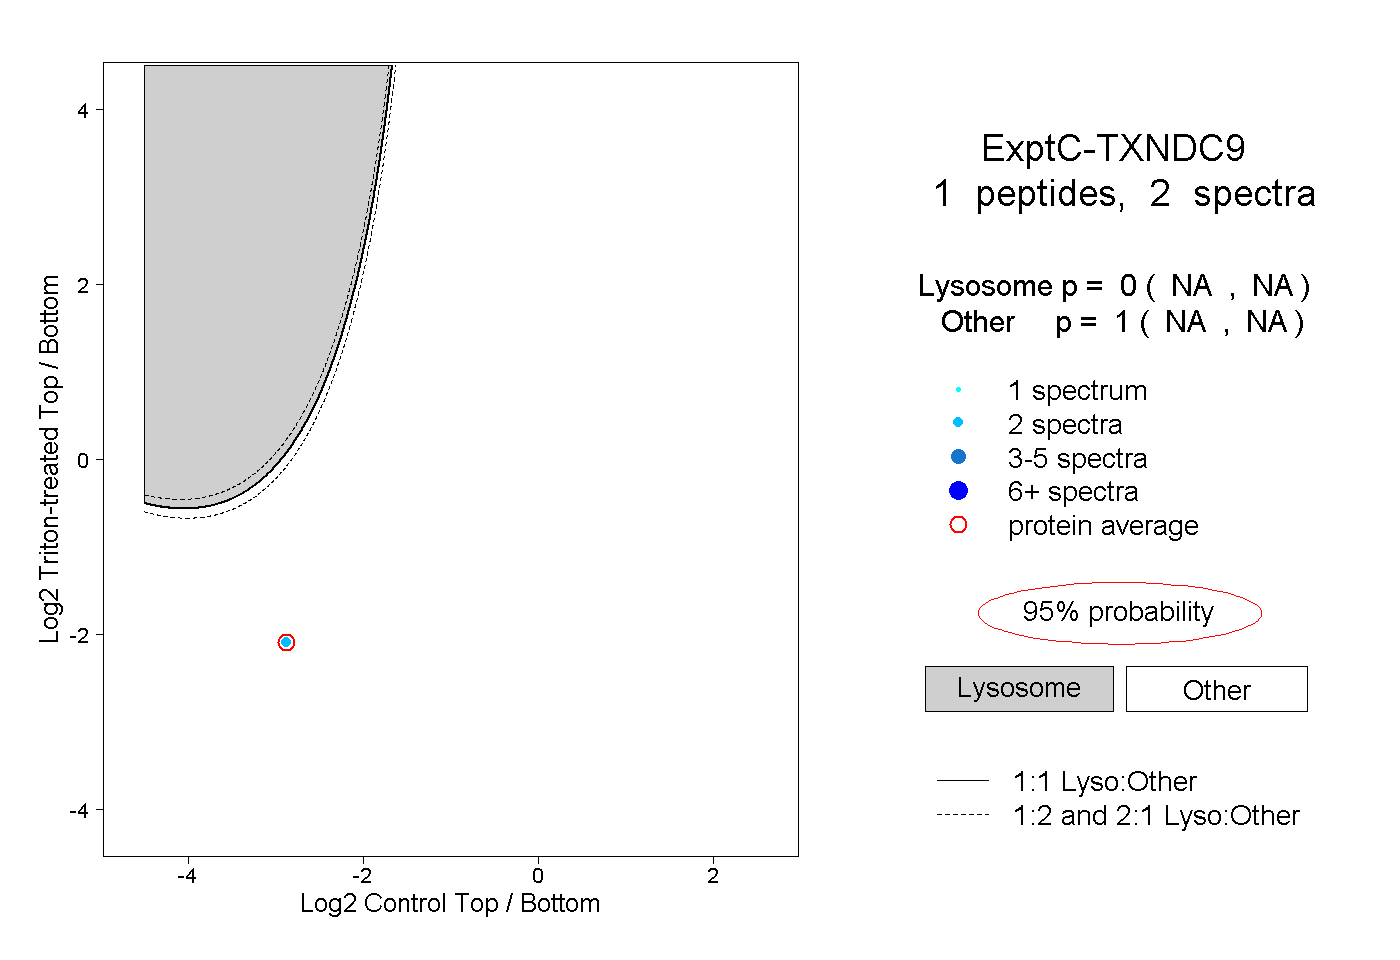
NA | NA
NA | NA