10
10peptides
spectra
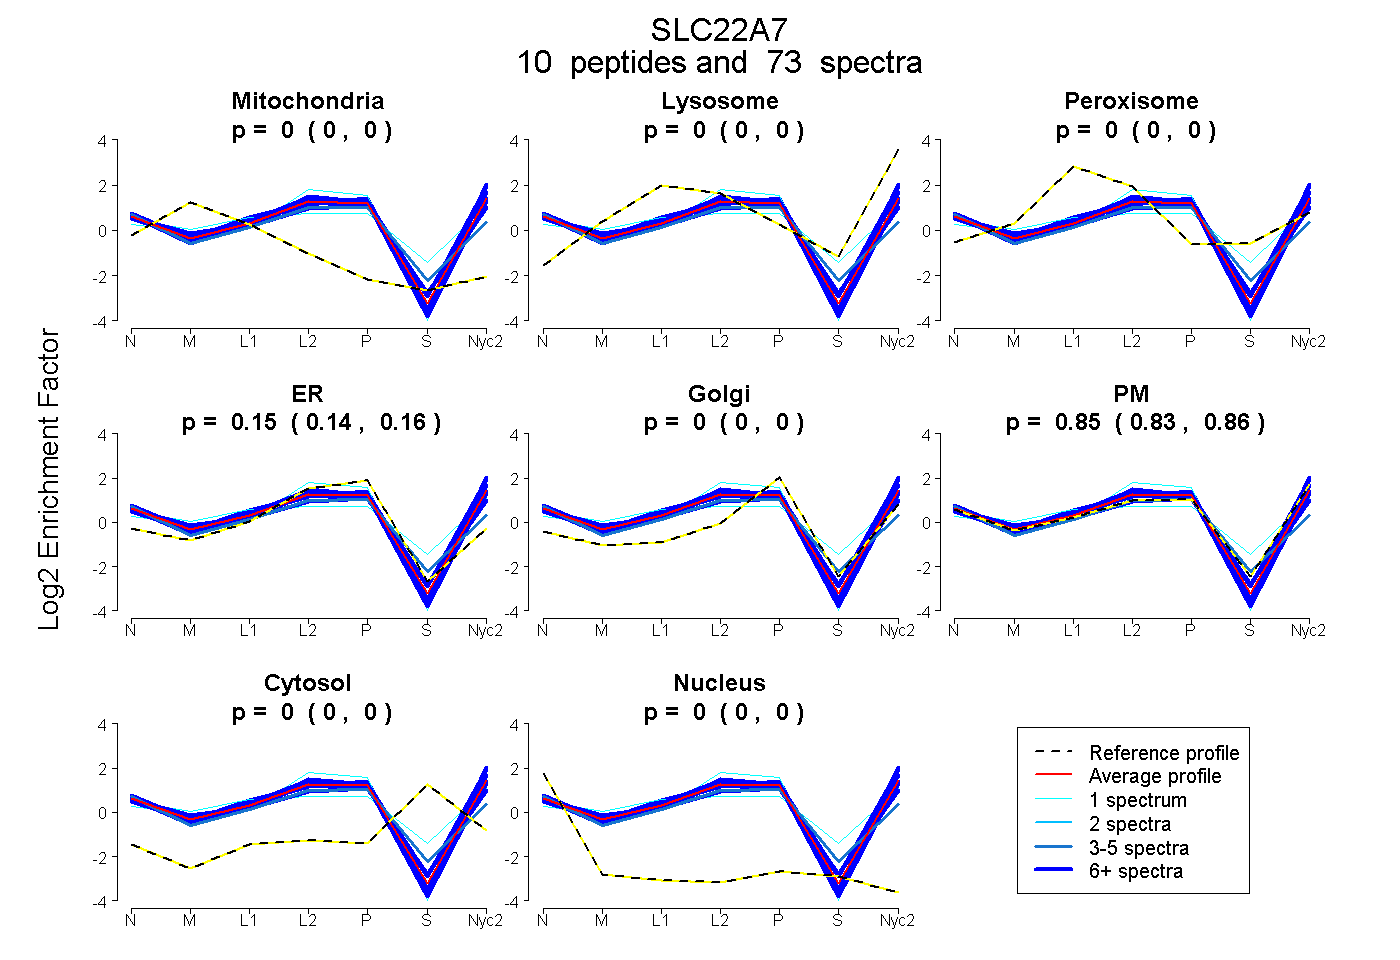
0.000 | 0.000
0.000 | 0.000
0.000 | 0.000
0.142 | 0.165
0.000 | 0.000
0.833 | 0.857
0.000 | 0.000
0.000 | 0.000
7peptides
spectra
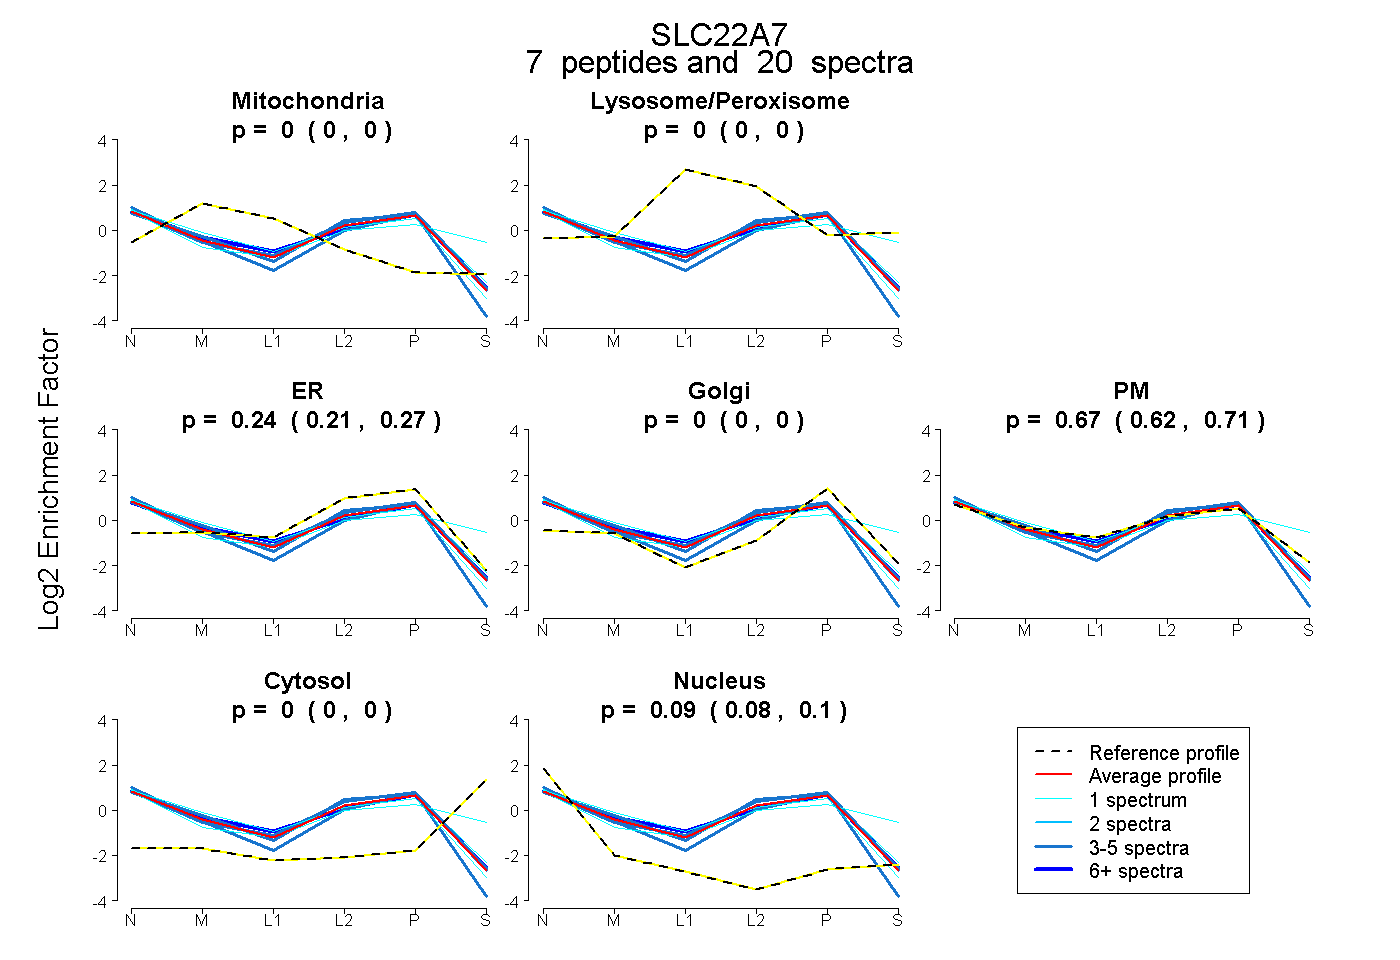
0.000 | 0.000
0.000 | 0.000
0.208 | 0.272
0.000 | 0.000
0.624 | 0.707
0.000 | 0.000
0.075 | 0.096
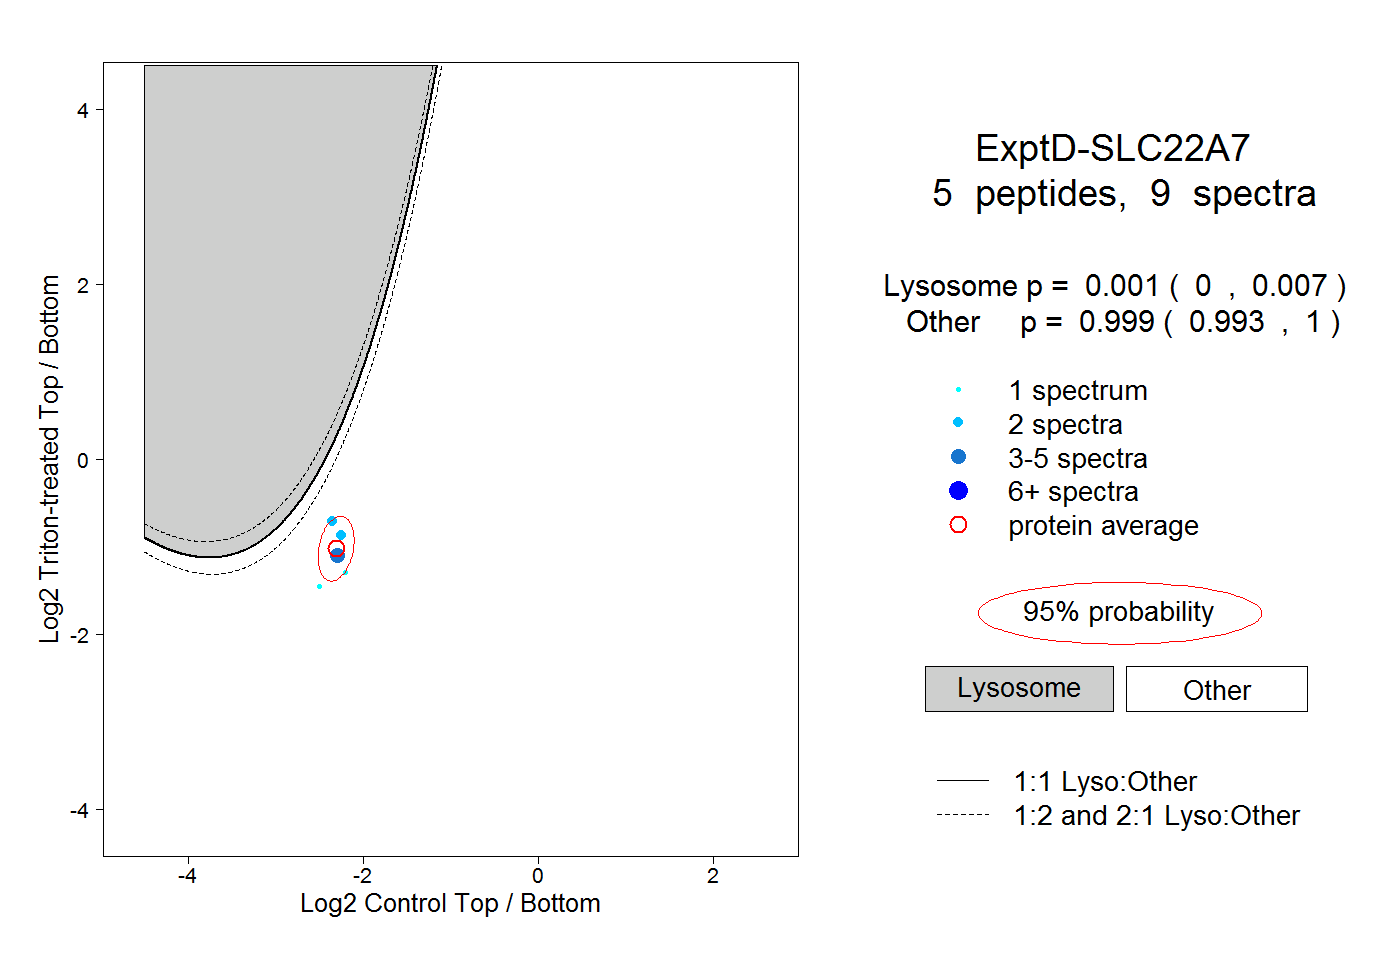
10peptides
spectra
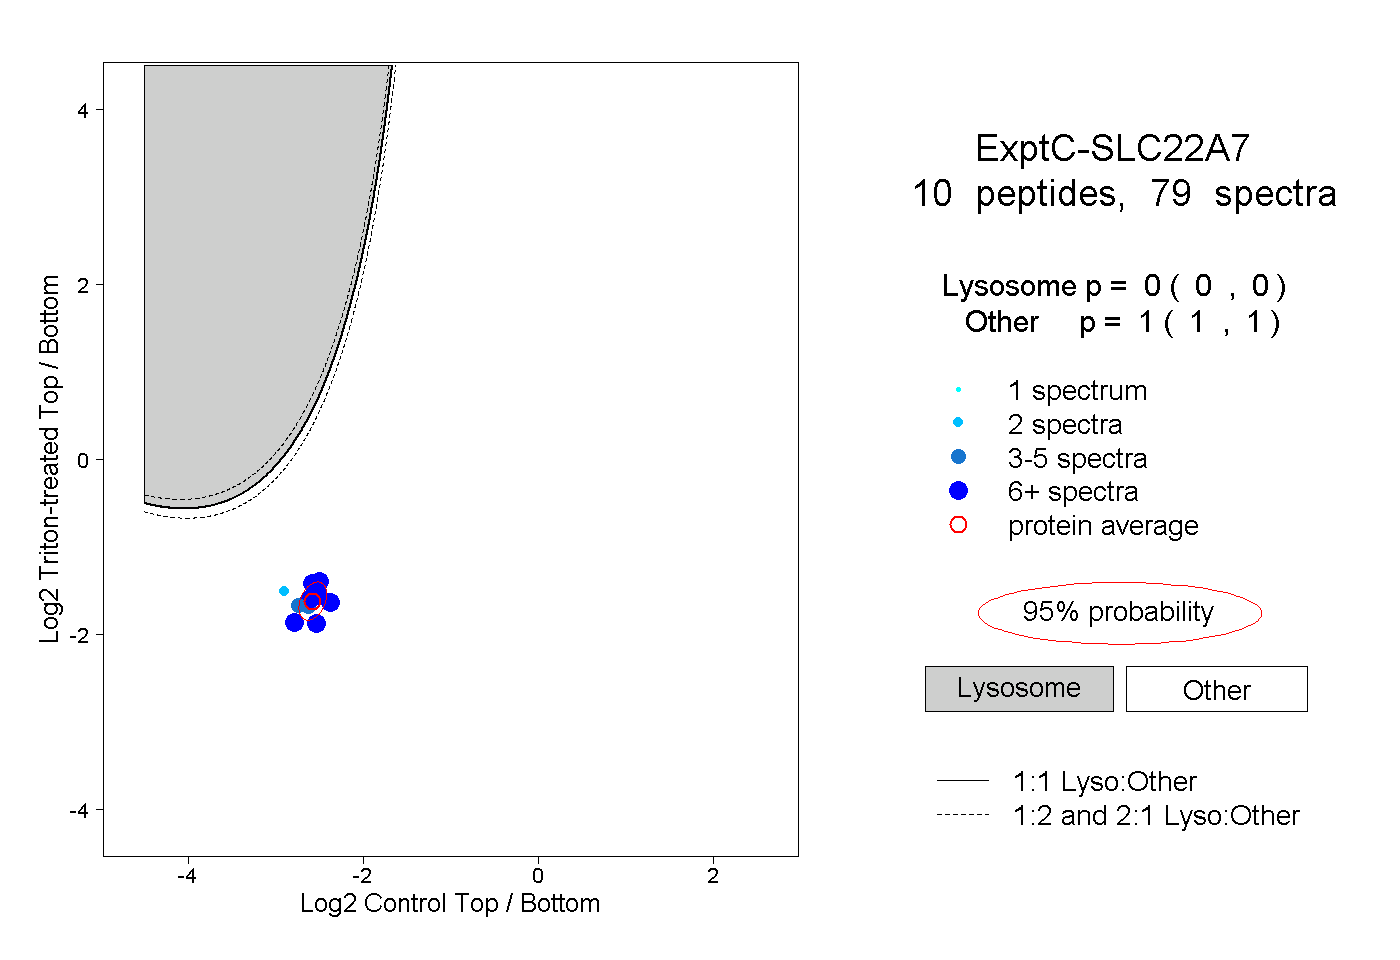
0.000 | 0.000
1.000 | 1.000