SLC22A7
[ENSRNOP00000025094]
Main page
| | | Plot |
Mito |
Lyso |
|
Perox |
ER |
Golgi |
PM |
Cytosol |
Nucleus |
|
| Expt A |
 10
10
peptides |
73
spectra |
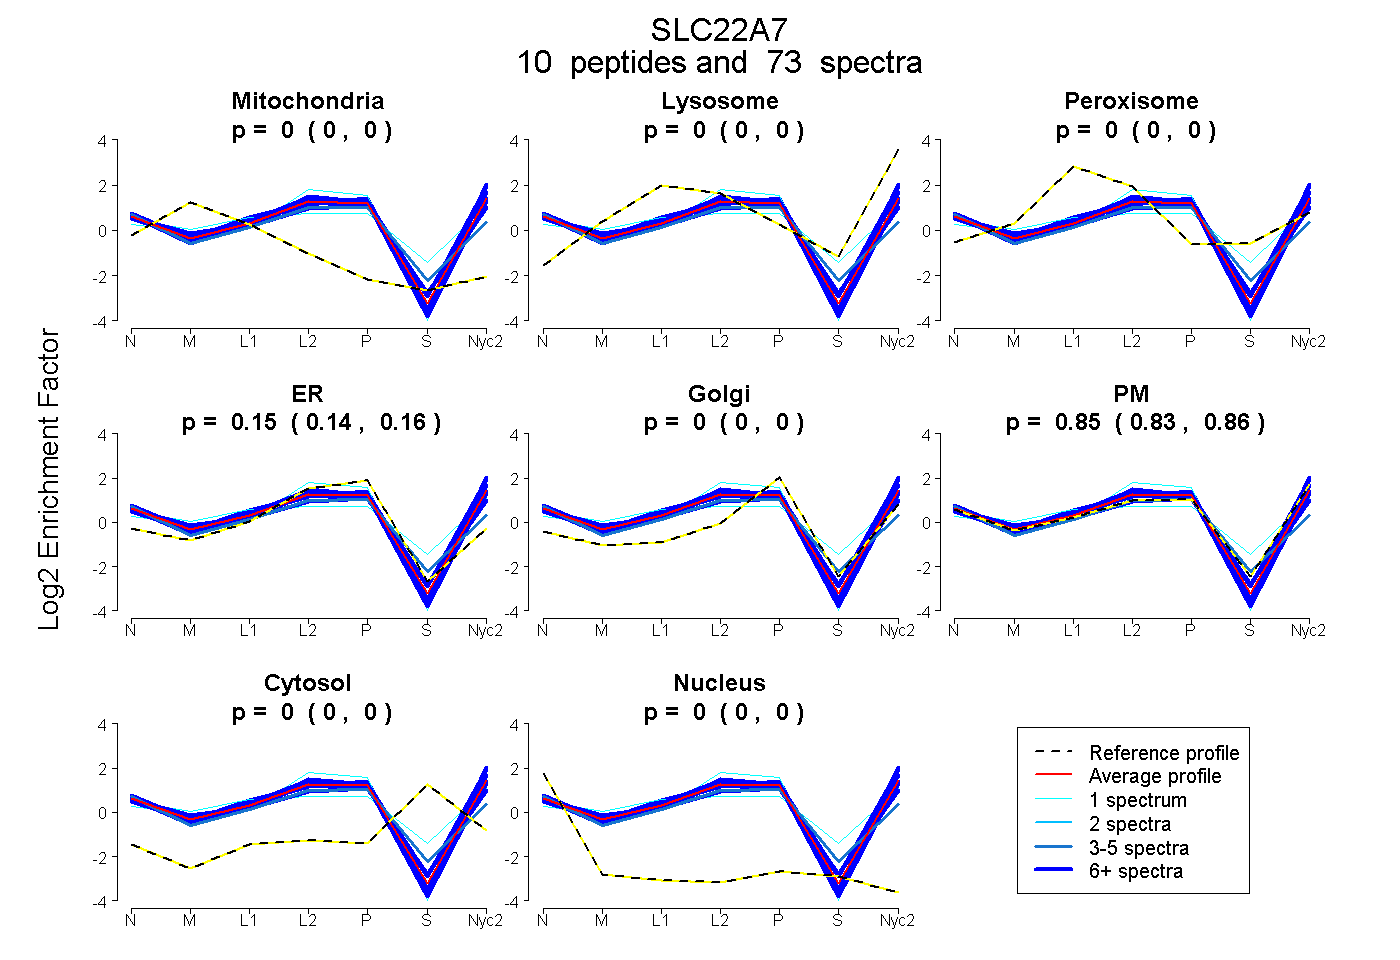 |
0.000
0.000 | 0.000 |
0.000
0.000 | 0.000 |
|
0.000
0.000 | 0.000 |
0.154
0.142 | 0.165 |
0.000
0.000 | 0.000 |
0.846
0.833 | 0.857 |
0.000
0.000 | 0.000 |
0.000
0.000 | 0.000 |
|
| | | Plot |
Mito |
|
Lyso or Perox |
|
ER |
Golgi |
PM |
Cytosol |
Nucleus |
|
| Expt B |
7
peptides |
20
spectra |
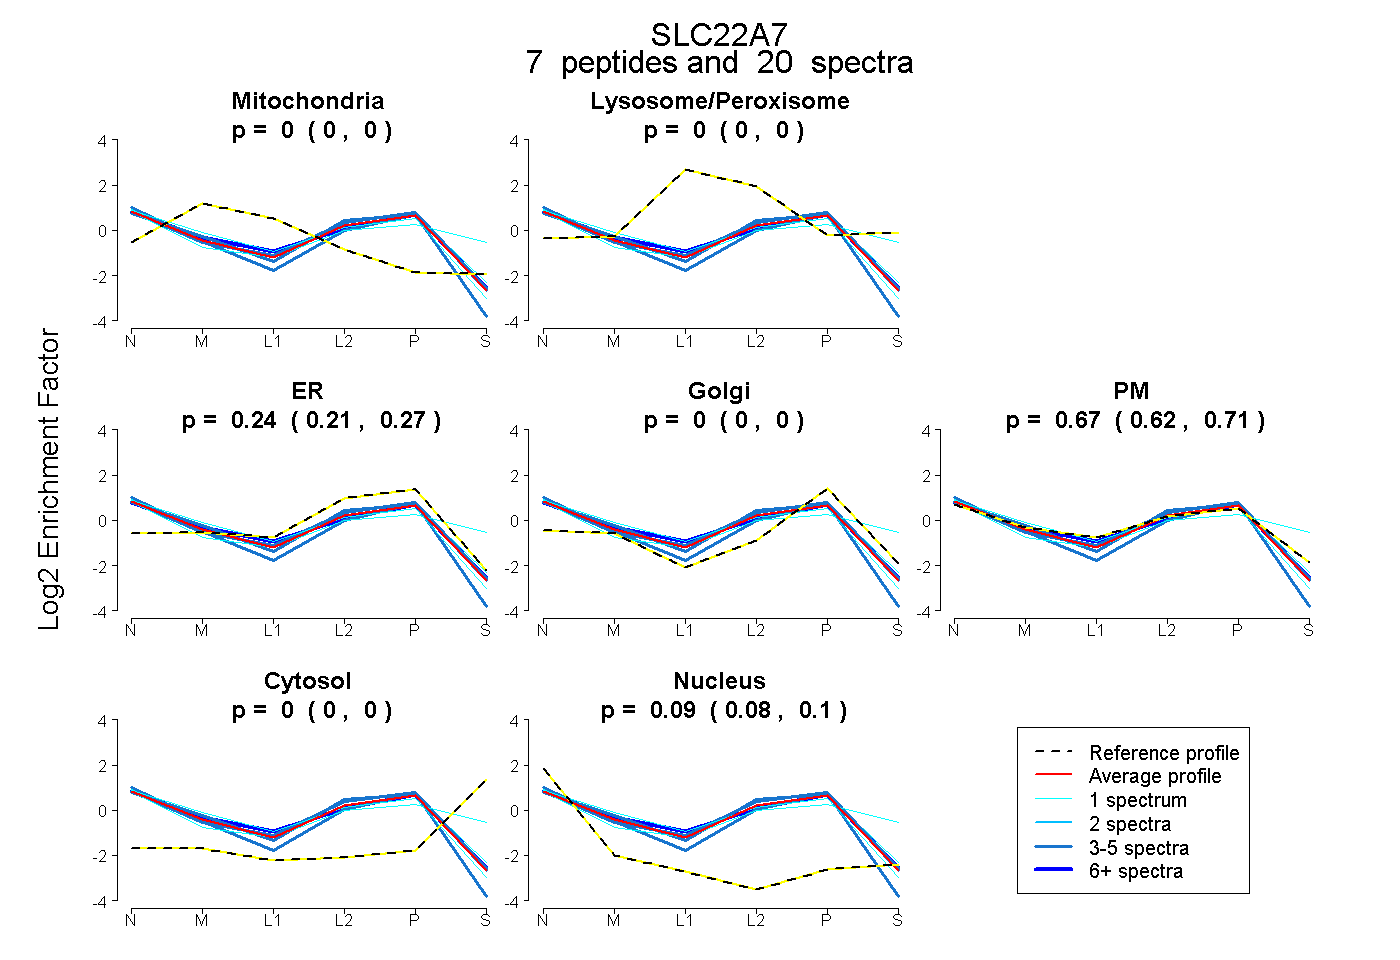 |
0.000
0.000 | 0.000 |
|
0.000
0.000 | 0.000 |
|
0.244
0.208 | 0.272 |
0.000
0.000 | 0.000 |
0.671
0.624 | 0.707 |
0.000
0.000 | 0.000 |
0.086
0.075 | 0.096 |
|
| 1 spectrum, WLLTQGR |
0.000 |
|
0.000 |
|
0.141 |
0.000 |
0.800 |
0.000 |
0.059 |
|
| 4 spectra, VGGFGPFQLR |
0.000 |
|
0.000 |
|
0.265 |
0.000 |
0.682 |
0.000 |
0.053 |
|
| 3 spectra, ETDGSFSSCLR |
0.000 |
|
0.000 |
|
0.590 |
0.000 |
0.172 |
0.000 |
0.238 |
|
| 4 spectra, NLVLMALPR |
0.000 |
|
0.000 |
|
0.277 |
0.000 |
0.668 |
0.000 |
0.055 |
|
| 6 spectra, ALQRPSYLDLFR |
0.000 |
|
0.000 |
|
0.153 |
0.000 |
0.799 |
0.000 |
0.049 |
|
| 1 spectrum, YLLSCAK |
0.000 |
|
0.027 |
|
0.000 |
0.000 |
0.770 |
0.204 |
0.000 |
|
| 1 spectrum, GFEDLLDK |
0.000 |
|
0.000 |
|
0.164 |
0.000 |
0.798 |
0.000 |
0.038 |
|
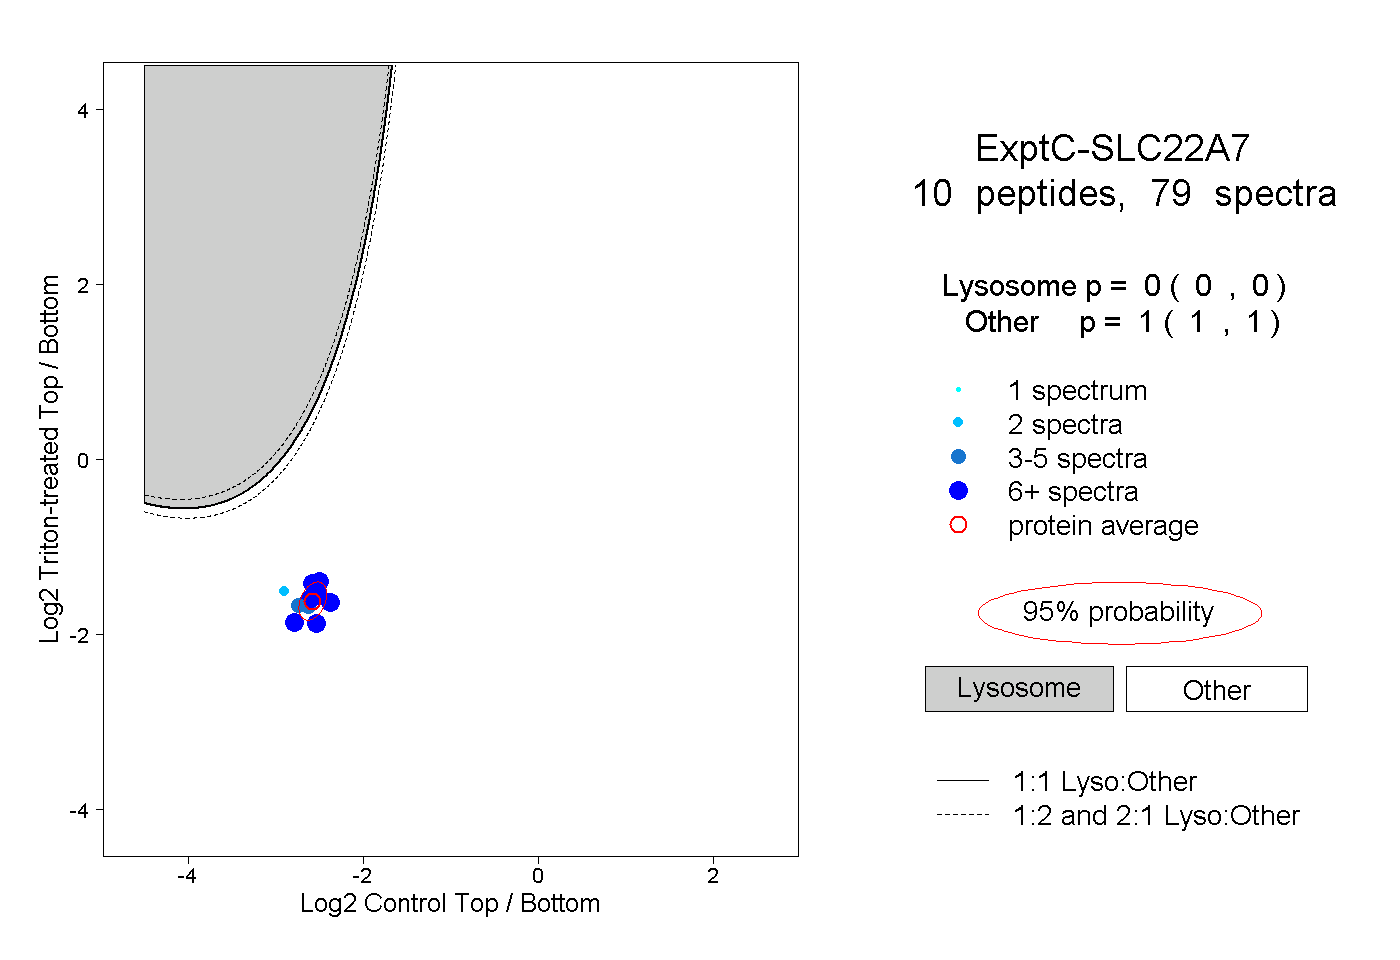
| | | Plot |
|
Lyso |
|
|
|
|
|
|
|
Other |
| Expt C |
10
peptides |
79
spectra |
 |
|
0.000
0.000 | 0.000 |
|
|
|
|
|
|
|
1.000
1.000 | 1.000 |
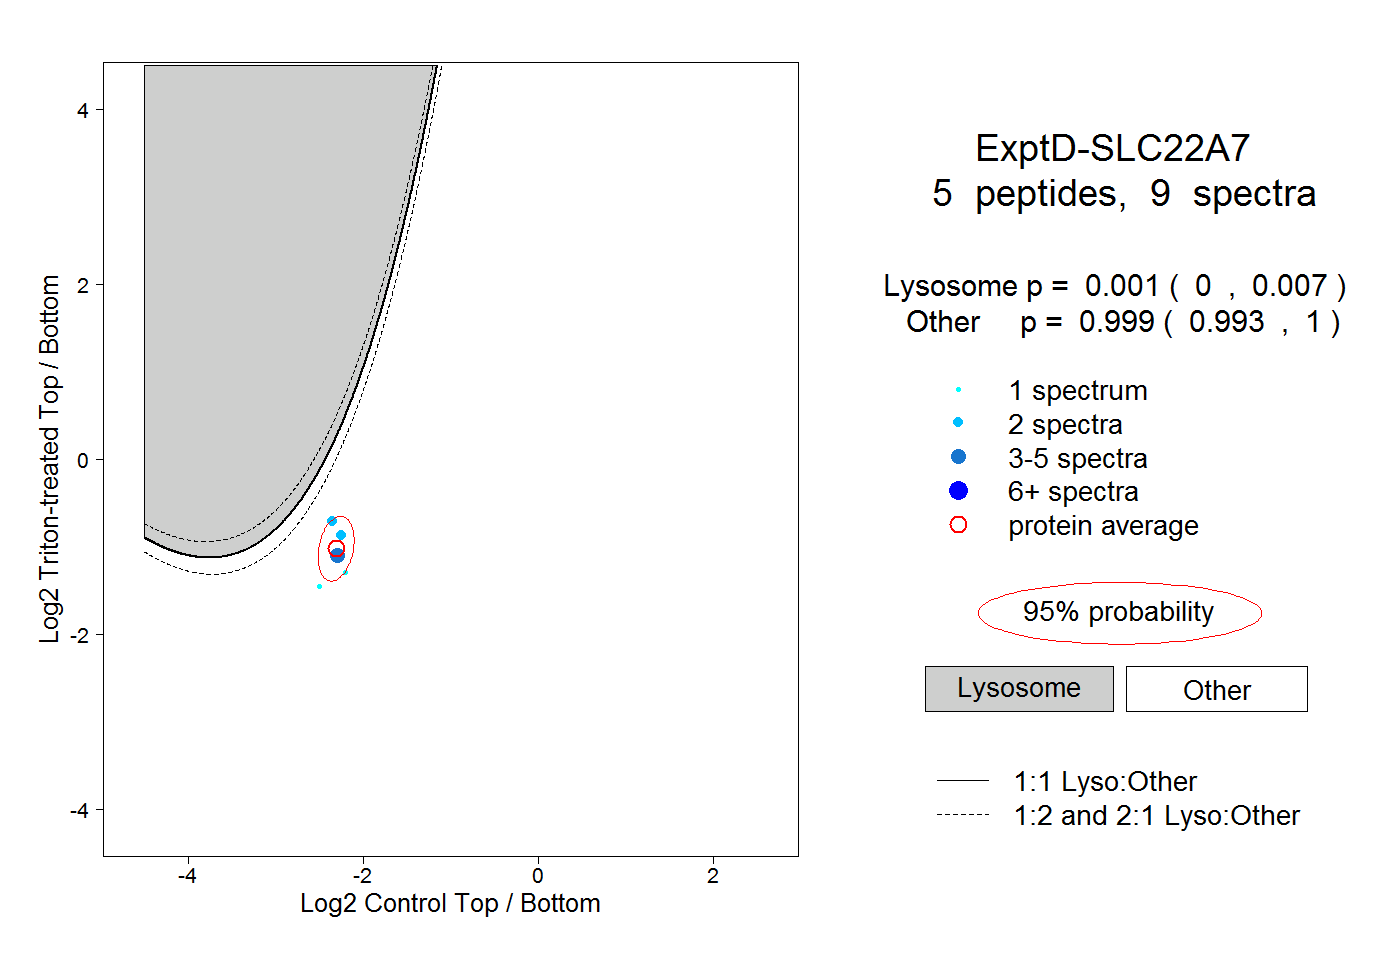
| | | Plot |
|
Lyso |
|
|
|
|
|
|
|
Other |
| Expt D |
5
peptides |
9
spectra |
 |
|
0.001
0.000 | 0.007 |
|
|
|
|
|
|
|
0.999
0.993 | 1.000 |