 2
2peptides
spectra
NA | NA
NA | NA
NA | NA
NA | NA
NA | NA
NA | NA
NA | NA
NA | NA
2peptides
spectra
0.001 | 1.000
0.000 | 0.999
1peptide
spectrum
NA | NA
NA | NA
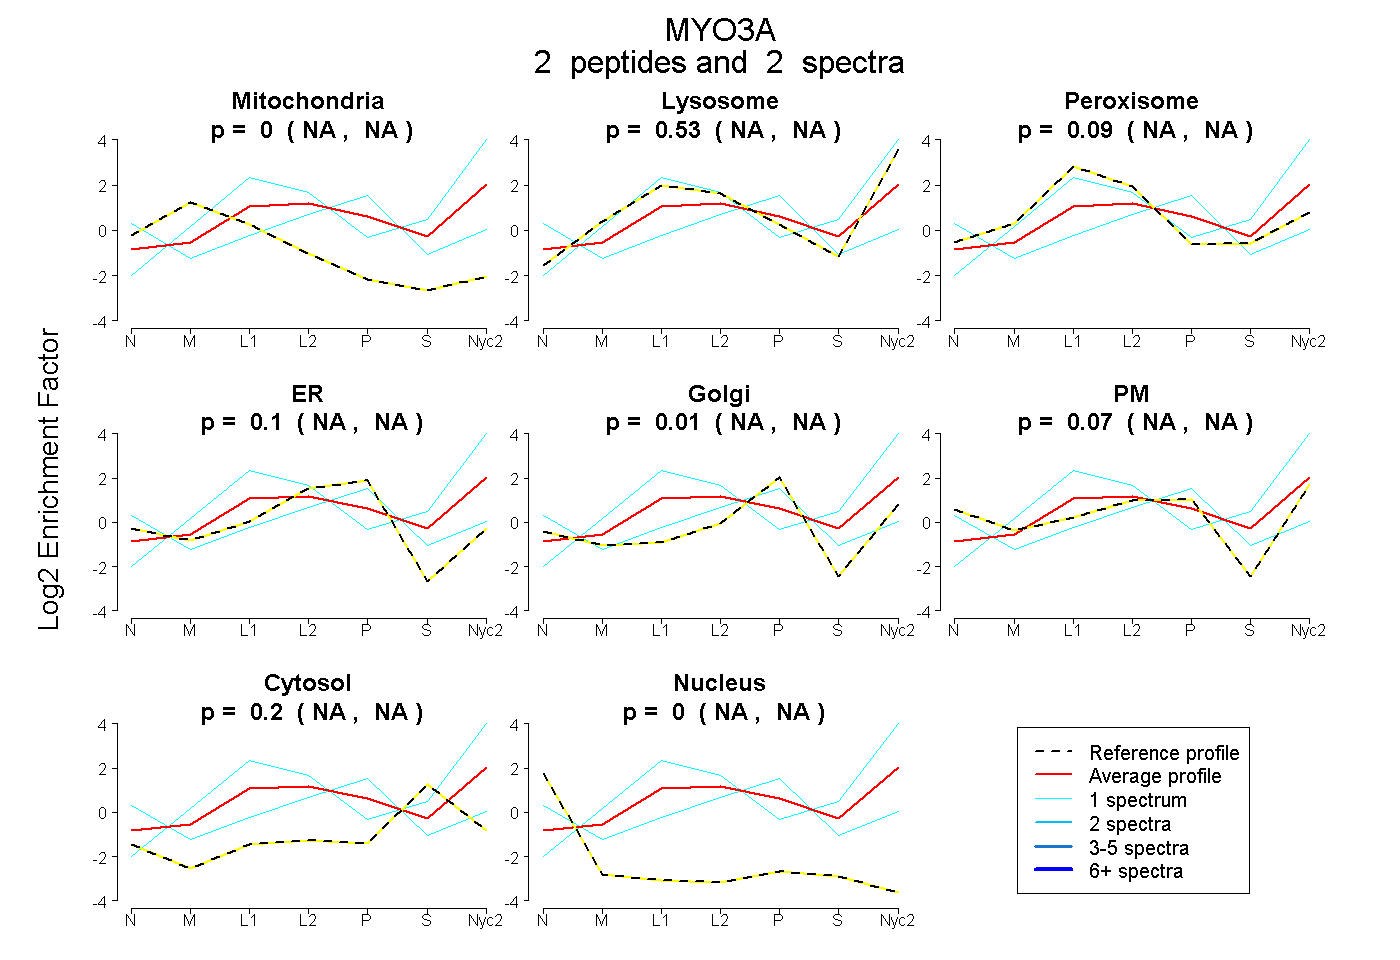
| Plot | Mito | Lyso | Perox | ER | Golgi | PM | Cytosol | Nucleus | |||||
| Expt A |
2 peptides |
2 spectra |
|
0.000 NA | NA |
0.534 NA | NA |
0.089 NA | NA |
0.097 NA | NA |
0.013 NA | NA |
0.070 NA | NA |
0.196 NA | NA |
0.000 NA | NA |
||
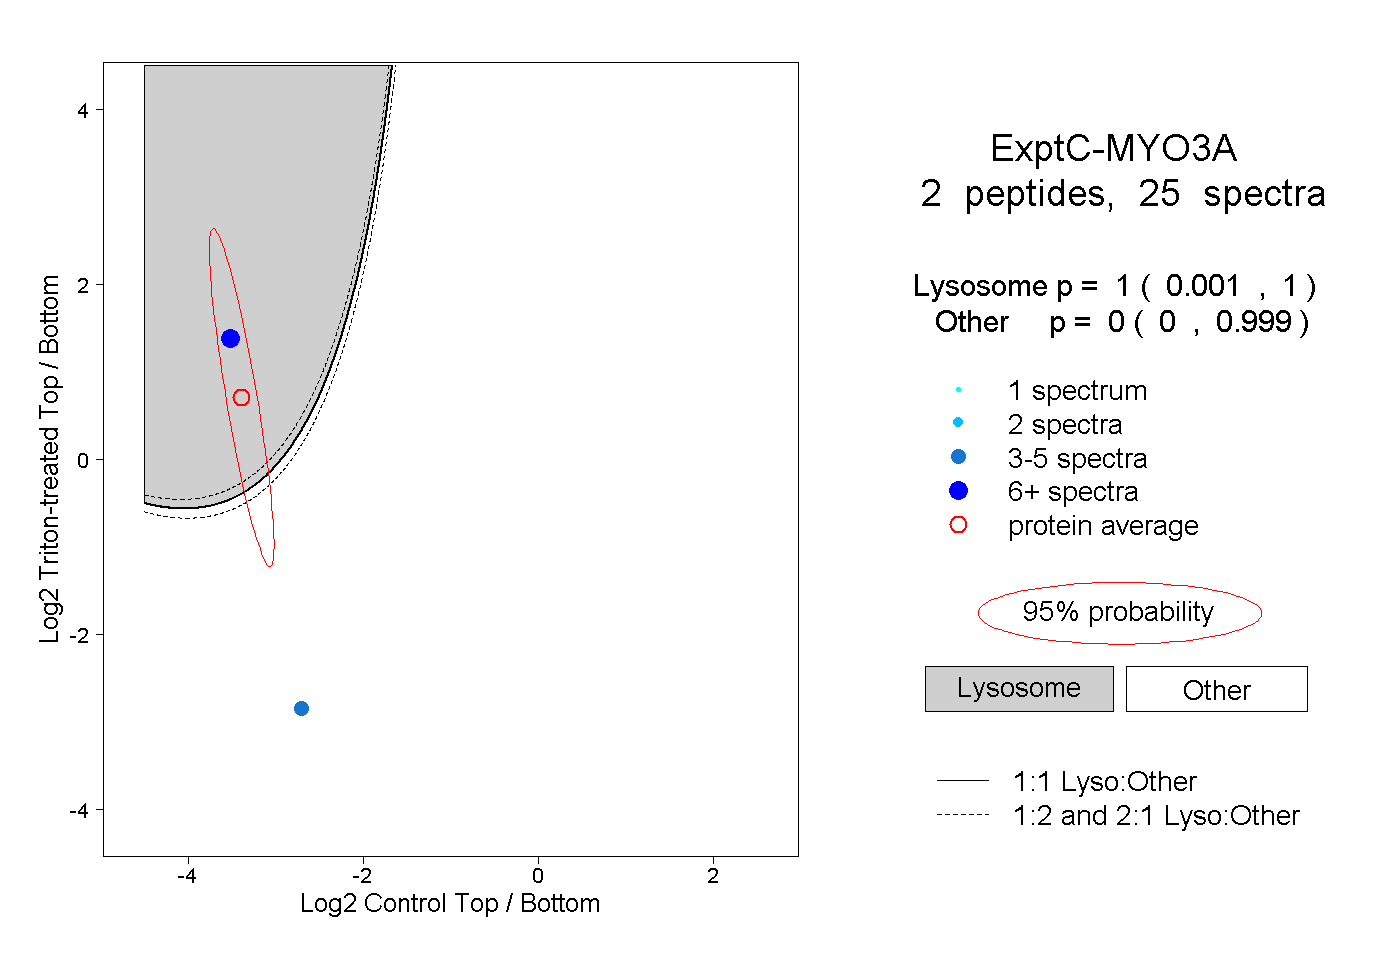
| Plot | Lyso | Other | |||||||||||
| Expt C |
2 peptides |
25 spectra |
|
1.000 0.001 | 1.000 |
0.000 0.000 | 0.999 |
||||||||
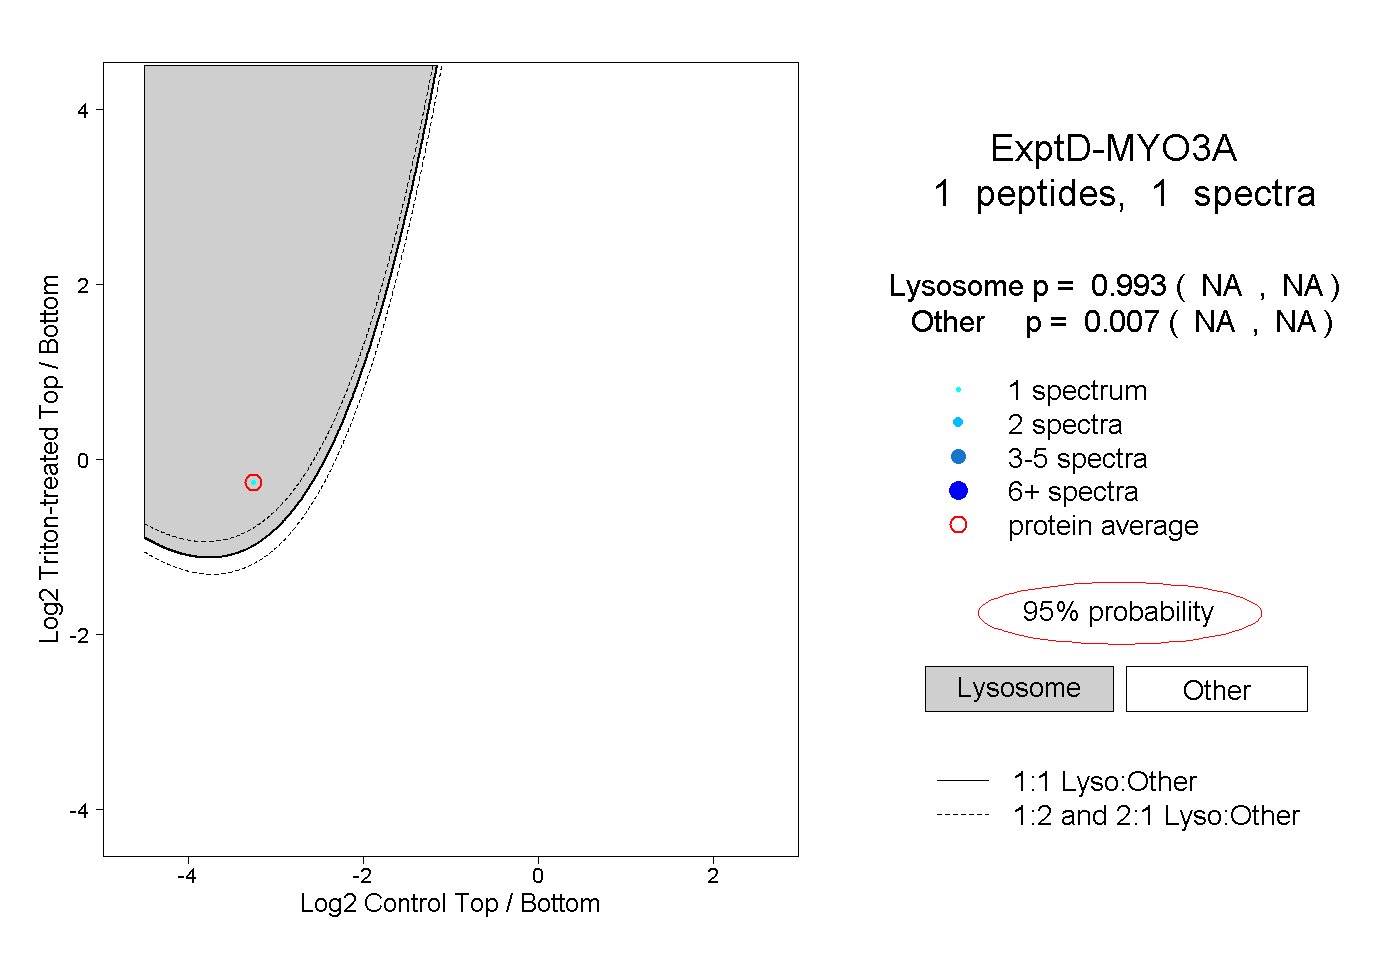
| Plot | Lyso | Other | |||||||||||
| Expt D |
1 peptide |
1 spectrum |
|
0.993 NA | NA |
0.007 NA | NA |