 3
3peptides
spectra
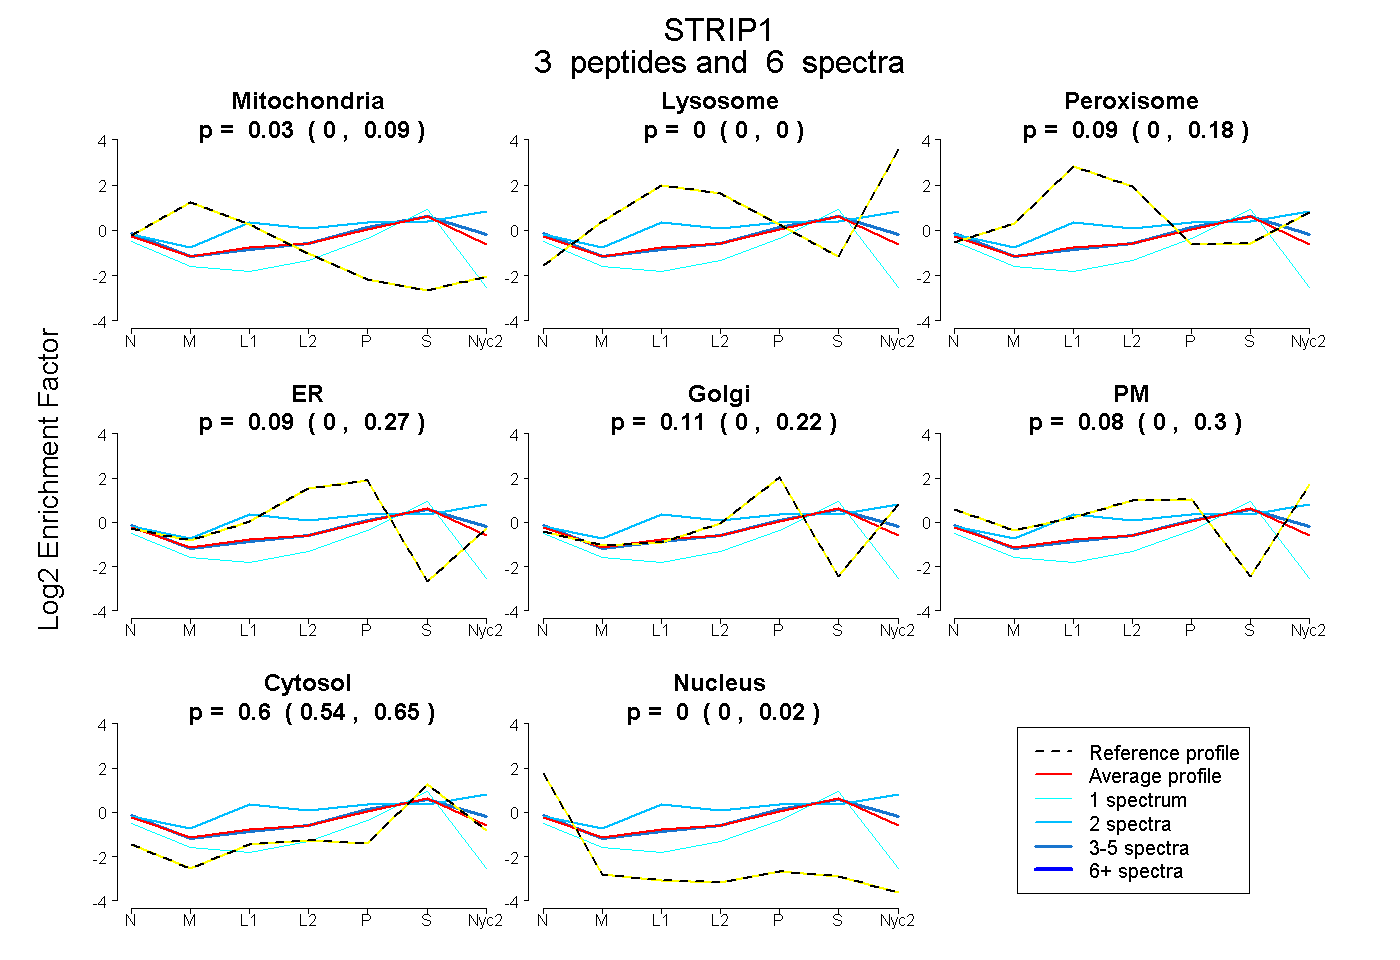
0.000 | 0.089
0.000 | 0.000
0.000 | 0.183
0.000 | 0.272
0.000 | 0.222
0.000 | 0.302
0.539 | 0.646
0.000 | 0.024
| Plot | Mito | Lyso | Perox | ER | Golgi | PM | Cytosol | Nucleus | |||||
| Expt A |
3 peptides |
6 spectra |
|
0.029 0.000 | 0.089 |
0.000 0.000 | 0.000 |
0.086 0.000 | 0.183 |
0.094 0.000 | 0.272 |
0.107 0.000 | 0.222 |
0.080 0.000 | 0.302 |
0.603 0.539 | 0.646 |
0.000 0.000 | 0.024 |
| 3 spectra, CFEEDFR | 0.000 | 0.000 | 0.041 | 0.000 | 0.079 | 0.273 | 0.606 | 0.000 | ||
| 2 spectra, ILLAAAPTSK | 0.000 | 0.101 | 0.211 | 0.000 | 0.031 | 0.265 | 0.392 | 0.000 | ||
| 1 spectrum, NLFSCINLLR | 0.028 | 0.000 | 0.000 | 0.101 | 0.000 | 0.000 | 0.709 | 0.162 |
| Plot | Lyso | Other | |||||||||||
| Expt C |
3 peptides |
4 spectra |
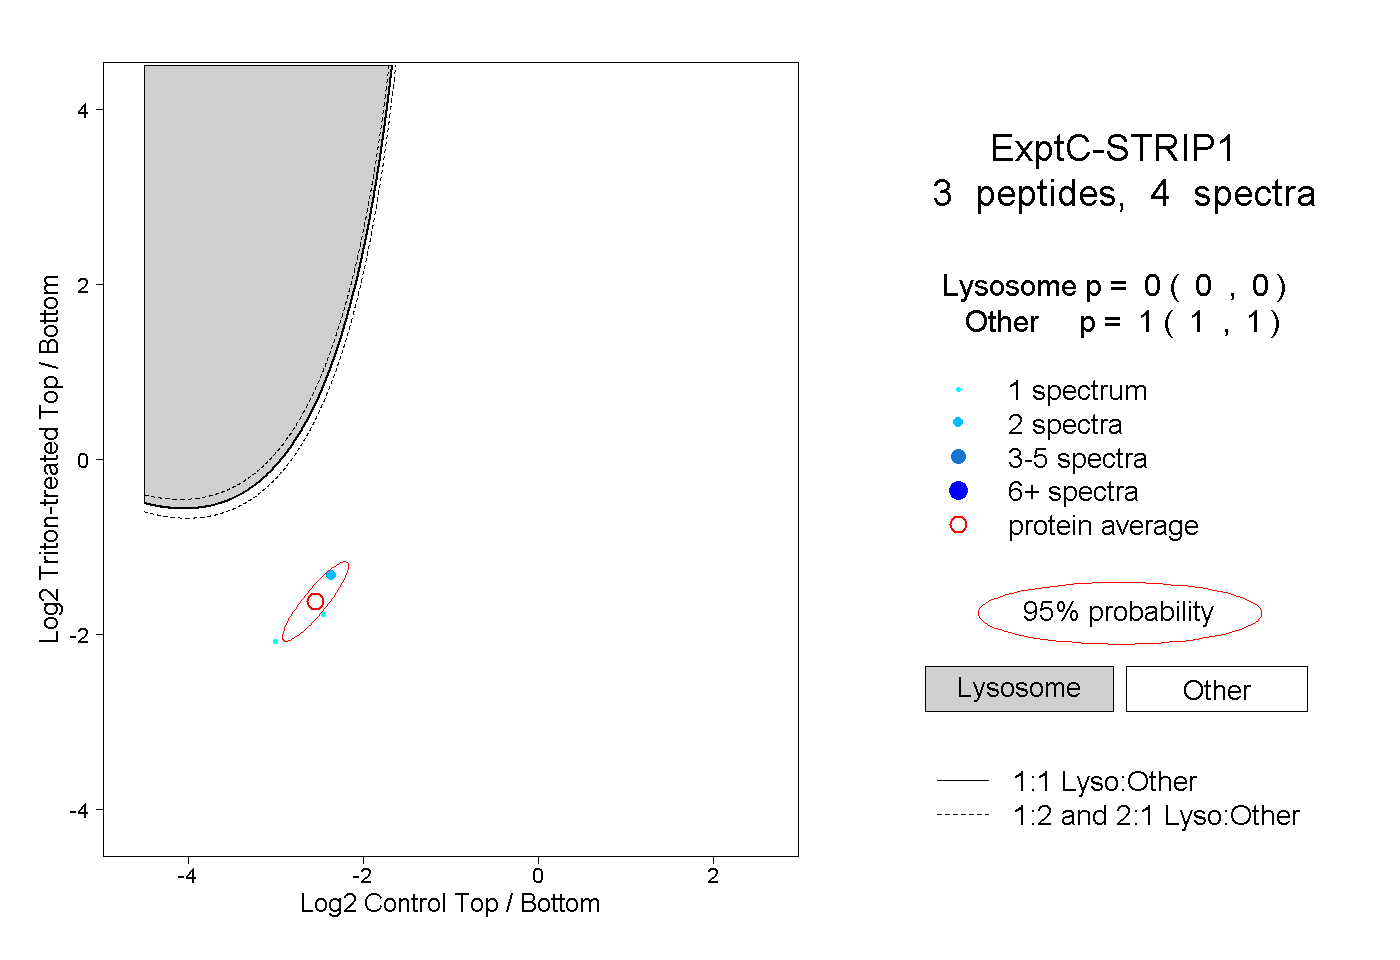 |
0.000 0.000 | 0.000 |
1.000 1.000 | 1.000 |