 4
4peptides
spectra
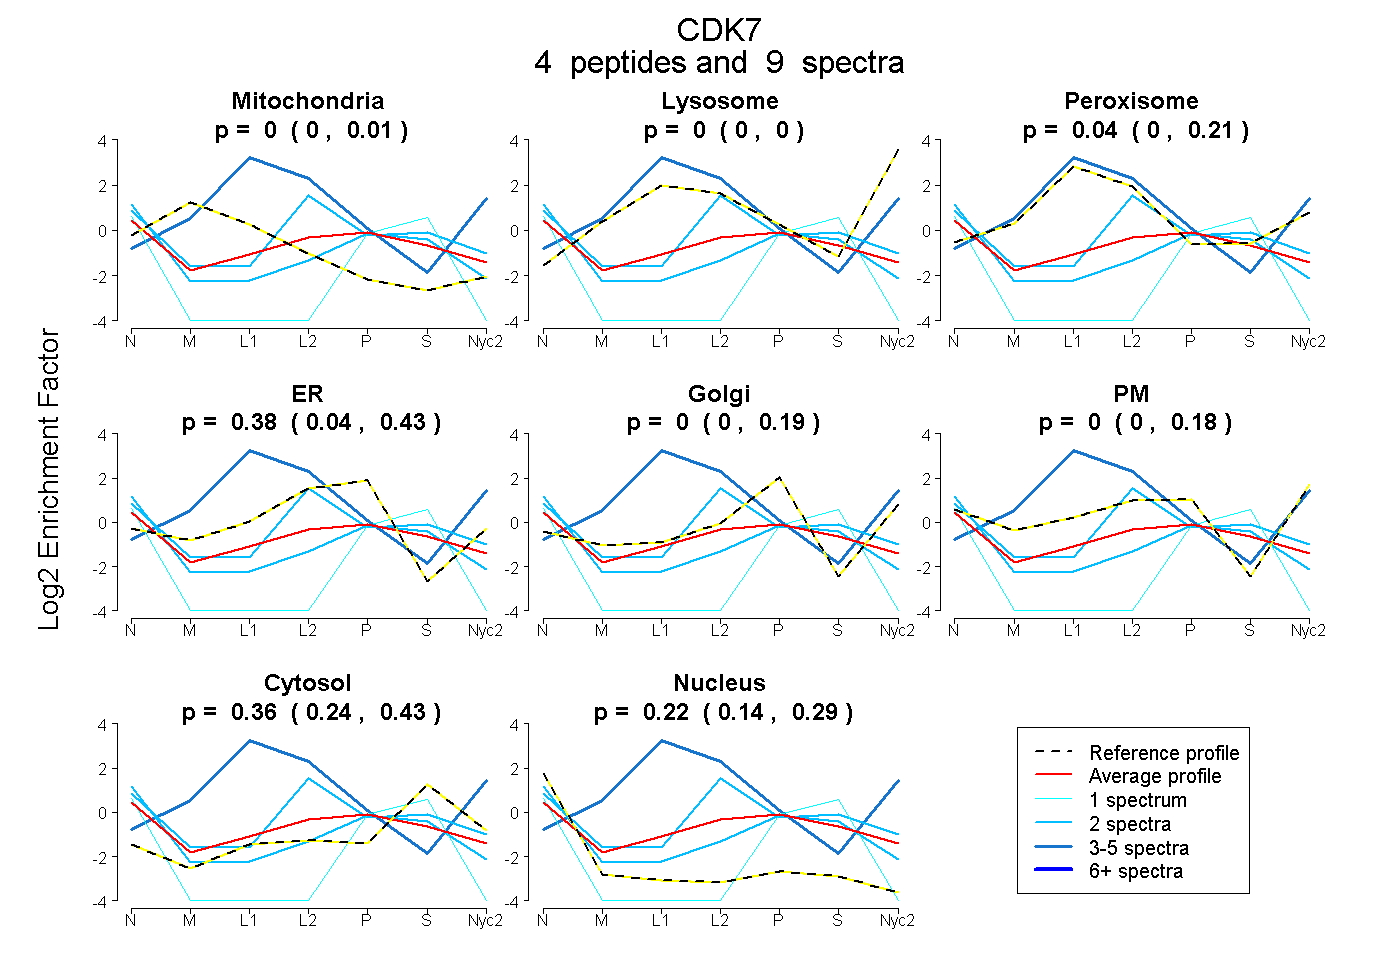
0.000 | 0.010
0.000 | 0.000
0.000 | 0.206
0.035 | 0.427
0.000 | 0.185
0.000 | 0.182
0.239 | 0.431
0.143 | 0.293
| Plot | Mito | Lyso | Perox | ER | Golgi | PM | Cytosol | Nucleus | |||||
| Expt A |
4 peptides |
9 spectra |
|
0.000 0.000 | 0.010 |
0.000 0.000 | 0.000 |
0.042 0.000 | 0.206 |
0.377 0.035 | 0.427 |
0.000 0.000 | 0.185 |
0.000 0.000 | 0.182 |
0.364 0.239 | 0.431 |
0.218 0.143 | 0.293 |
| 2 spectra, ITASQALR | 0.000 | 0.000 | 0.000 | 0.179 | 0.067 | 0.000 | 0.359 | 0.395 | ||
| 4 spectra, AVDVK | 0.000 | 0.257 | 0.674 | 0.069 | 0.000 | 0.000 | 0.000 | 0.000 | ||
| 1 spectrum, VPFLPGDSDLDQLTR | 0.000 | 0.000 | 0.000 | 0.000 | 0.000 | 0.000 | 0.389 | 0.611 | ||
| 2 spectra, AYTHQVVTR | 0.000 | 0.000 | 0.066 | 0.429 | 0.000 | 0.018 | 0.380 | 0.108 |
| Plot | Lyso | Other | |||||||||||
| Expt C |
1 peptide |
38 spectra |
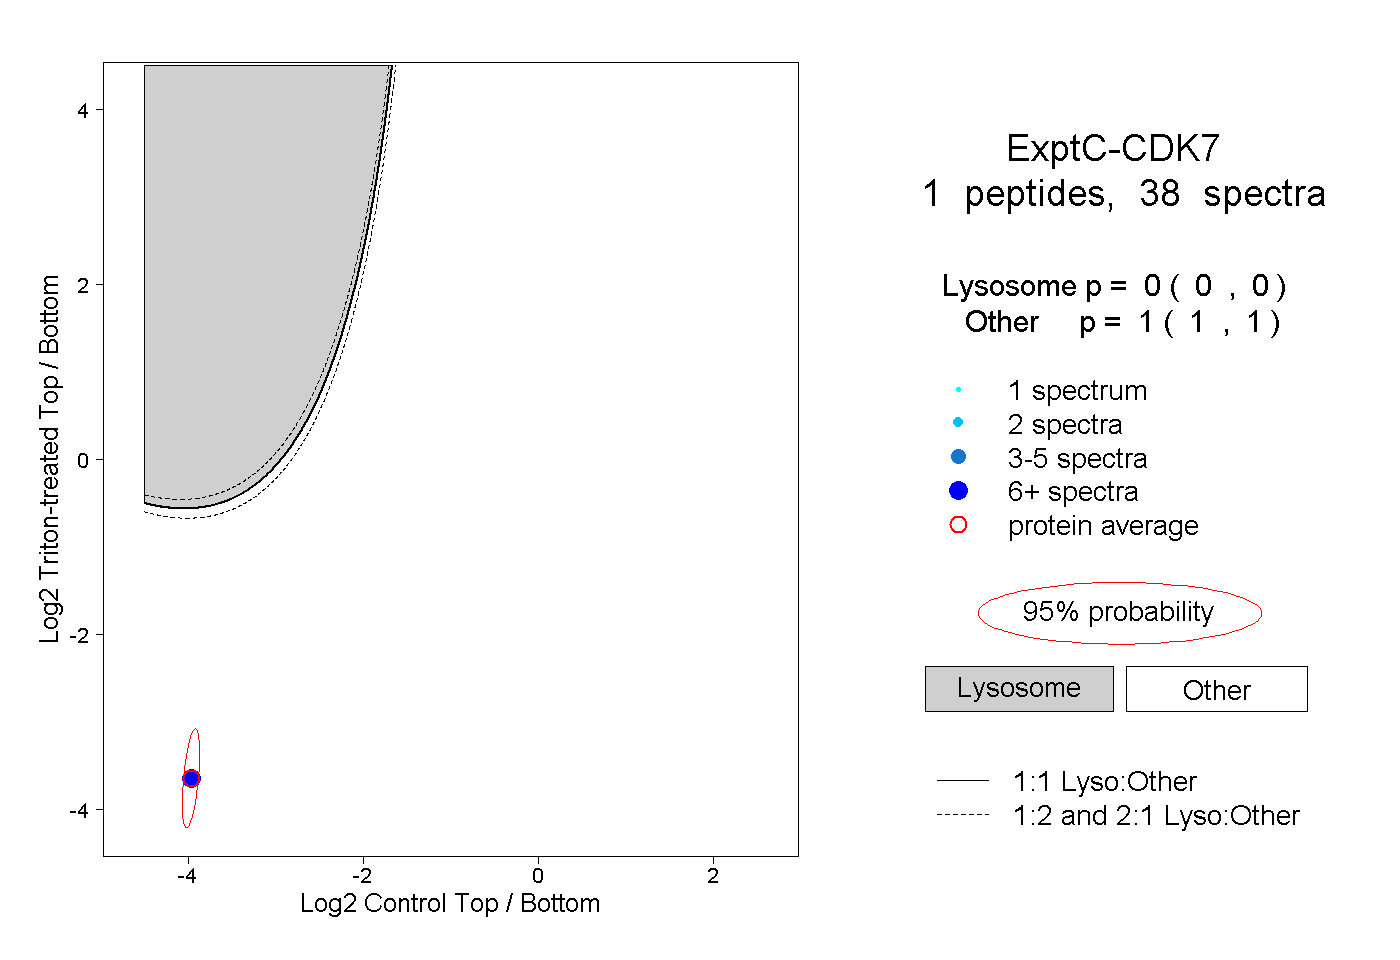 |
0.000 0.000 | 0.000 |
1.000 1.000 | 1.000 |