| 19 spectra, AQIFLK |
1.000 |
|
0.000 |
|
0.000 |
0.000 |
0.000 |
0.000 |
0.000 |
|
| 6 spectra, LYVPQSLWPQIK |
0.895 |
|
0.057 |
|
0.000 |
0.004 |
0.000 |
0.045 |
0.000 |
|
| 5 spectra, ETHKPLGDWR |
0.770 |
|
0.108 |
|
0.000 |
0.000 |
0.000 |
0.122 |
0.000 |
|
| 16 spectra, WLEHAR |
0.971 |
|
0.000 |
|
0.000 |
0.000 |
0.000 |
0.029 |
0.000 |
|
| 7 spectra, LAGECGGK |
0.924 |
|
0.053 |
|
0.024 |
0.000 |
0.000 |
0.000 |
0.000 |
|
| 21 spectra, AADMLSGPR |
0.980 |
|
0.000 |
|
0.000 |
0.000 |
0.000 |
0.015 |
0.006 |
|
| 12 spectra, VGNPAEDFGTFFSAVIDAK |
0.849 |
|
0.037 |
|
0.000 |
0.000 |
0.000 |
0.115 |
0.000 |
|
| 9 spectra, VANEPILAFTQGSPER |
0.936 |
|
0.000 |
|
0.000 |
0.052 |
0.000 |
0.012 |
0.000 |
|
| 1 spectrum, SAFEYGGQK |
1.000 |
|
0.000 |
|
0.000 |
0.000 |
0.000 |
0.000 |
0.000 |
|
| 2 spectra, CSACSR |
0.925 |
|
0.000 |
|
0.000 |
0.000 |
0.000 |
0.000 |
0.075 |
|
| 34 spectra, AIEAAVLAR |
0.972 |
|
0.000 |
|
0.000 |
0.000 |
0.000 |
0.000 |
0.028 |
|
| 4 spectra, DPQEPIMK |
0.761 |
|
0.156 |
|
0.000 |
0.013 |
0.000 |
0.070 |
0.000 |
|
| 4 spectra, TMVGQGK |
0.959 |
|
0.033 |
|
0.000 |
0.000 |
0.000 |
0.000 |
0.008 |
|
| 2 spectra, WTSPQVIK |
0.954 |
|
0.000 |
|
0.000 |
0.000 |
0.000 |
0.000 |
0.046 |
|
| 3 spectra, FCYADK |
0.804 |
|
0.125 |
|
0.000 |
0.000 |
0.000 |
0.071 |
0.000 |
|
| 32 spectra, QVAQNLDR |
1.000 |
|
0.000 |
|
0.000 |
0.000 |
0.000 |
0.000 |
0.000 |
|
| 12 spectra, STGSVVGQQPFGGAR |
0.954 |
|
0.000 |
|
0.000 |
0.000 |
0.000 |
0.000 |
0.046 |
|
| 18 spectra, LLEEHSR |
0.984 |
|
0.000 |
|
0.000 |
0.000 |
0.000 |
0.000 |
0.016 |
|
| 8 spectra, YQLSPFNHGHK |
0.676 |
|
0.225 |
|
0.000 |
0.071 |
0.000 |
0.028 |
0.000 |
|
| 12 spectra, NAAGNFYINDK |
0.991 |
|
0.005 |
|
0.000 |
0.000 |
0.000 |
0.004 |
0.000 |
|
| 44 spectra, TIVQEATR |
0.999 |
|
0.000 |
|
0.000 |
0.000 |
0.000 |
0.000 |
0.001 |
|
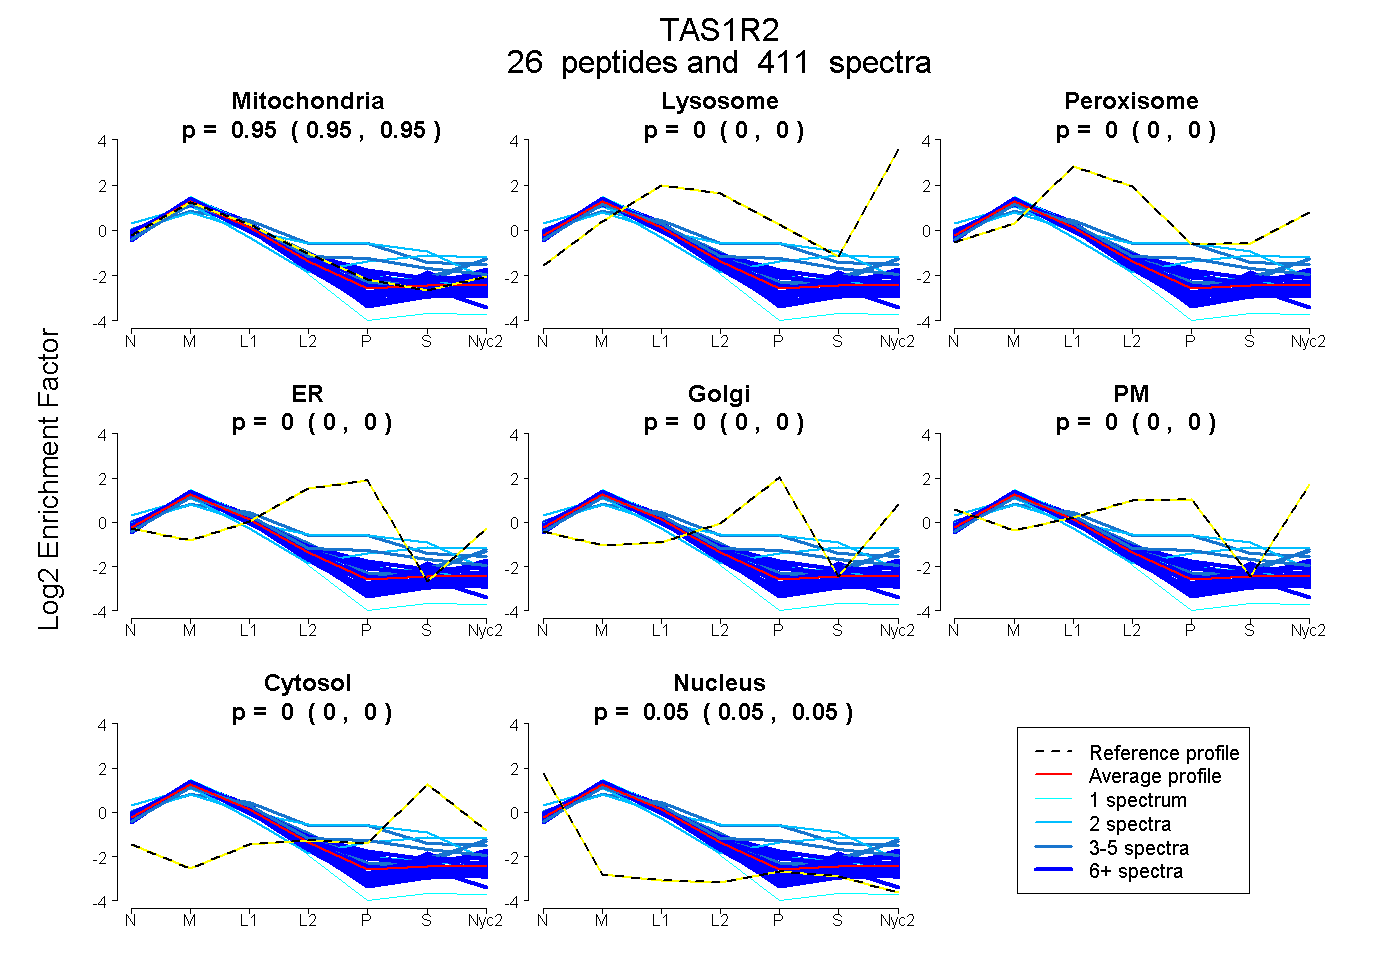
 26
26