 26
26peptides
spectra
0.952 | 0.953
0.000 | 0.000
0.000 | 0.000
0.000 | 0.000
0.000 | 0.000
0.000 | 0.000
0.000 | 0.000
0.047 | 0.048
| Plot | Mito | Lyso | Perox | ER | Golgi | PM | Cytosol | Nucleus | |||||
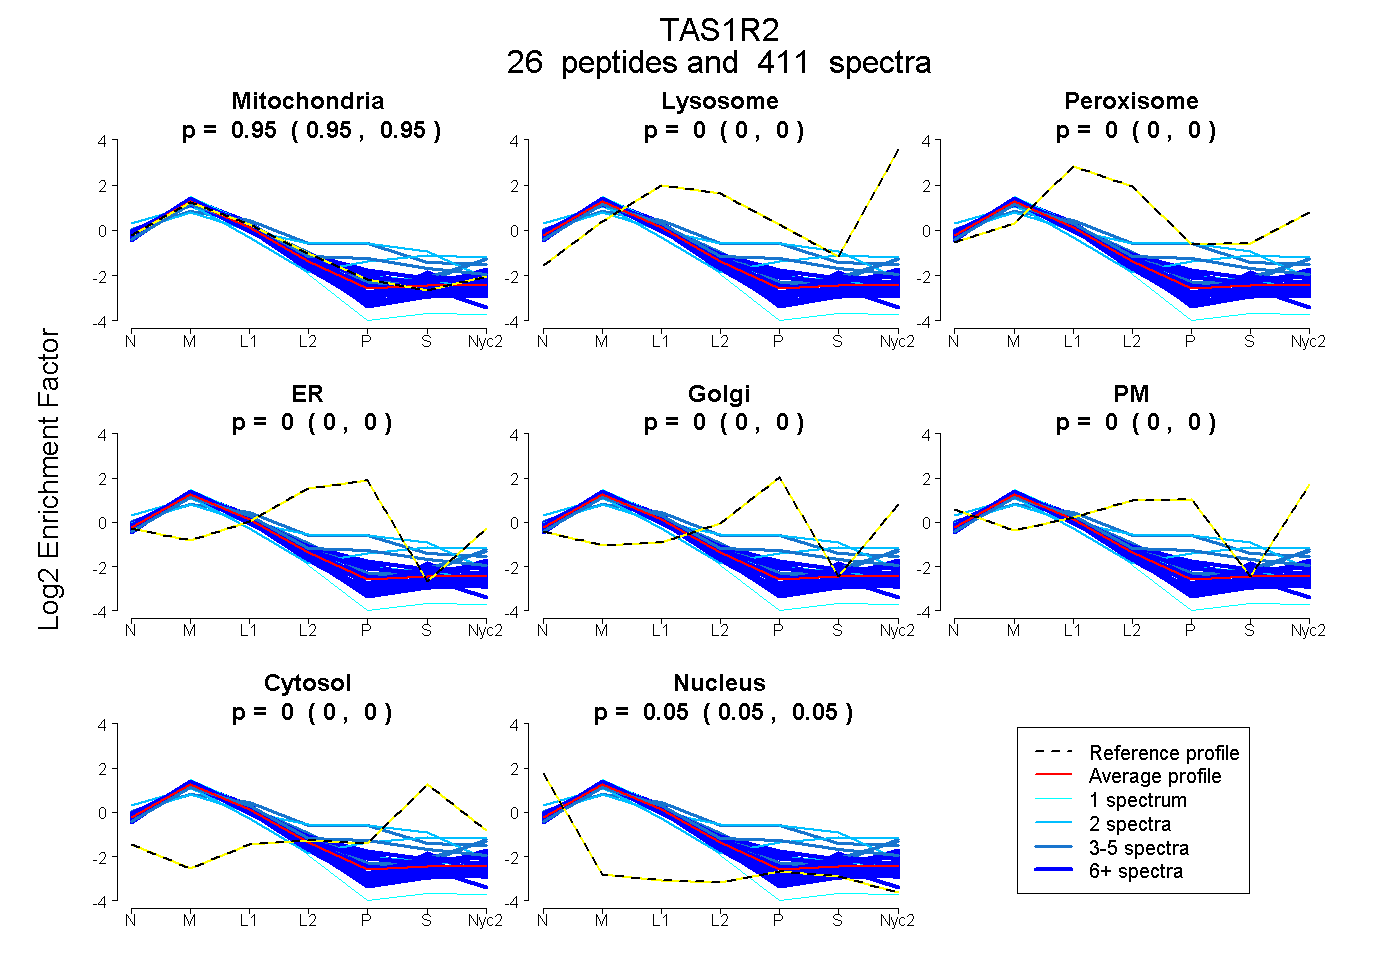
| Expt A |
26 peptides |
411 spectra |
|
0.952 0.952 | 0.953 |
0.000 0.000 | 0.000 |
0.000 0.000 | 0.000 |
0.000 0.000 | 0.000 |
0.000 0.000 | 0.000 |
0.000 0.000 | 0.000 |
0.000 0.000 | 0.000 |
0.048 0.047 | 0.048 |
| 24 spectra, AQIFLK | 0.915 | 0.000 | 0.000 | 0.000 | 0.000 | 0.000 | 0.000 | 0.085 | ||
| 11 spectra, LYVPQSLWPQIK | 0.935 | 0.000 | 0.000 | 0.000 | 0.000 | 0.000 | 0.032 | 0.033 | ||
| 13 spectra, ETHKPLGDWR | 0.934 | 0.000 | 0.000 | 0.000 | 0.000 | 0.000 | 0.000 | 0.066 | ||
| 27 spectra, WLEHAR | 0.939 | 0.000 | 0.000 | 0.000 | 0.000 | 0.000 | 0.061 | 0.000 | ||
| 5 spectra, LAGECGGK | 0.888 | 0.045 | 0.000 | 0.000 | 0.000 | 0.000 | 0.067 | 0.000 | ||
| 48 spectra, AADMLSGPR | 0.969 | 0.000 | 0.000 | 0.000 | 0.000 | 0.000 | 0.000 | 0.031 | ||
| 7 spectra, VGNPAEDFGTFFSAVIDAK | 0.932 | 0.000 | 0.000 | 0.000 | 0.000 | 0.000 | 0.000 | 0.068 | ||
| 13 spectra, VANEPILAFTQGSPER | 0.942 | 0.000 | 0.000 | 0.000 | 0.000 | 0.000 | 0.000 | 0.058 | ||
| 7 spectra, SAFEYGGQK | 0.936 | 0.000 | 0.000 | 0.000 | 0.000 | 0.000 | 0.000 | 0.064 | ||
| 25 spectra, AIEAAVLAR | 0.962 | 0.000 | 0.000 | 0.000 | 0.000 | 0.000 | 0.000 | 0.038 | ||
| 2 spectra, DPQEPIMK | 0.888 | 0.000 | 0.000 | 0.000 | 0.000 | 0.000 | 0.005 | 0.108 | ||
| 3 spectra, ASGITAHCGGPHYILR | 0.595 | 0.000 | 0.130 | 0.107 | 0.076 | 0.000 | 0.092 | 0.000 | ||
| 1 spectrum, EEIFGPVLTVYVYPDEK | 0.890 | 0.000 | 0.000 | 0.000 | 0.000 | 0.000 | 0.000 | 0.110 | ||
| 19 spectra, TMVGQGK | 0.965 | 0.000 | 0.000 | 0.000 | 0.000 | 0.000 | 0.000 | 0.035 | ||
| 12 spectra, WTSPQVIK | 0.964 | 0.000 | 0.000 | 0.000 | 0.000 | 0.000 | 0.000 | 0.036 | ||
| 12 spectra, FCYADK | 0.900 | 0.000 | 0.000 | 0.000 | 0.000 | 0.000 | 0.020 | 0.079 | ||
| 45 spectra, QVAQNLDR | 0.924 | 0.000 | 0.000 | 0.000 | 0.000 | 0.000 | 0.000 | 0.076 | ||
| 6 spectra, ALNDLK | 0.923 | 0.004 | 0.000 | 0.000 | 0.048 | 0.000 | 0.025 | 0.000 | ||
| 2 spectra, NFHFVHSSADVDSVVSGTLR | 0.705 | 0.027 | 0.000 | 0.000 | 0.038 | 0.000 | 0.230 | 0.000 | ||
| 18 spectra, STGSVVGQQPFGGAR | 0.924 | 0.000 | 0.000 | 0.000 | 0.000 | 0.000 | 0.000 | 0.076 | ||
| 52 spectra, LLEEHSR | 0.901 | 0.000 | 0.000 | 0.014 | 0.017 | 0.000 | 0.069 | 0.000 | ||
| 2 spectra, FAVELEGEQPISVPPSTNHVVYR | 0.599 | 0.000 | 0.037 | 0.168 | 0.000 | 0.000 | 0.197 | 0.000 | ||
| 4 spectra, YQLSPFNHGHK | 0.793 | 0.000 | 0.049 | 0.000 | 0.053 | 0.000 | 0.106 | 0.000 | ||
| 8 spectra, NAAGNFYINDK | 0.968 | 0.000 | 0.000 | 0.000 | 0.000 | 0.000 | 0.000 | 0.032 | ||
| 42 spectra, TIVQEATR | 0.920 | 0.000 | 0.000 | 0.000 | 0.000 | 0.000 | 0.000 | 0.080 | ||
| 3 spectra, EWDLKPVADR | 0.883 | 0.082 | 0.000 | 0.000 | 0.000 | 0.000 | 0.034 | 0.001 |
| Plot | Mito | Lyso or Perox | ER | Golgi | PM | Cytosol | Nucleus | ||||||
| Expt B |
21 peptides |
271 spectra |
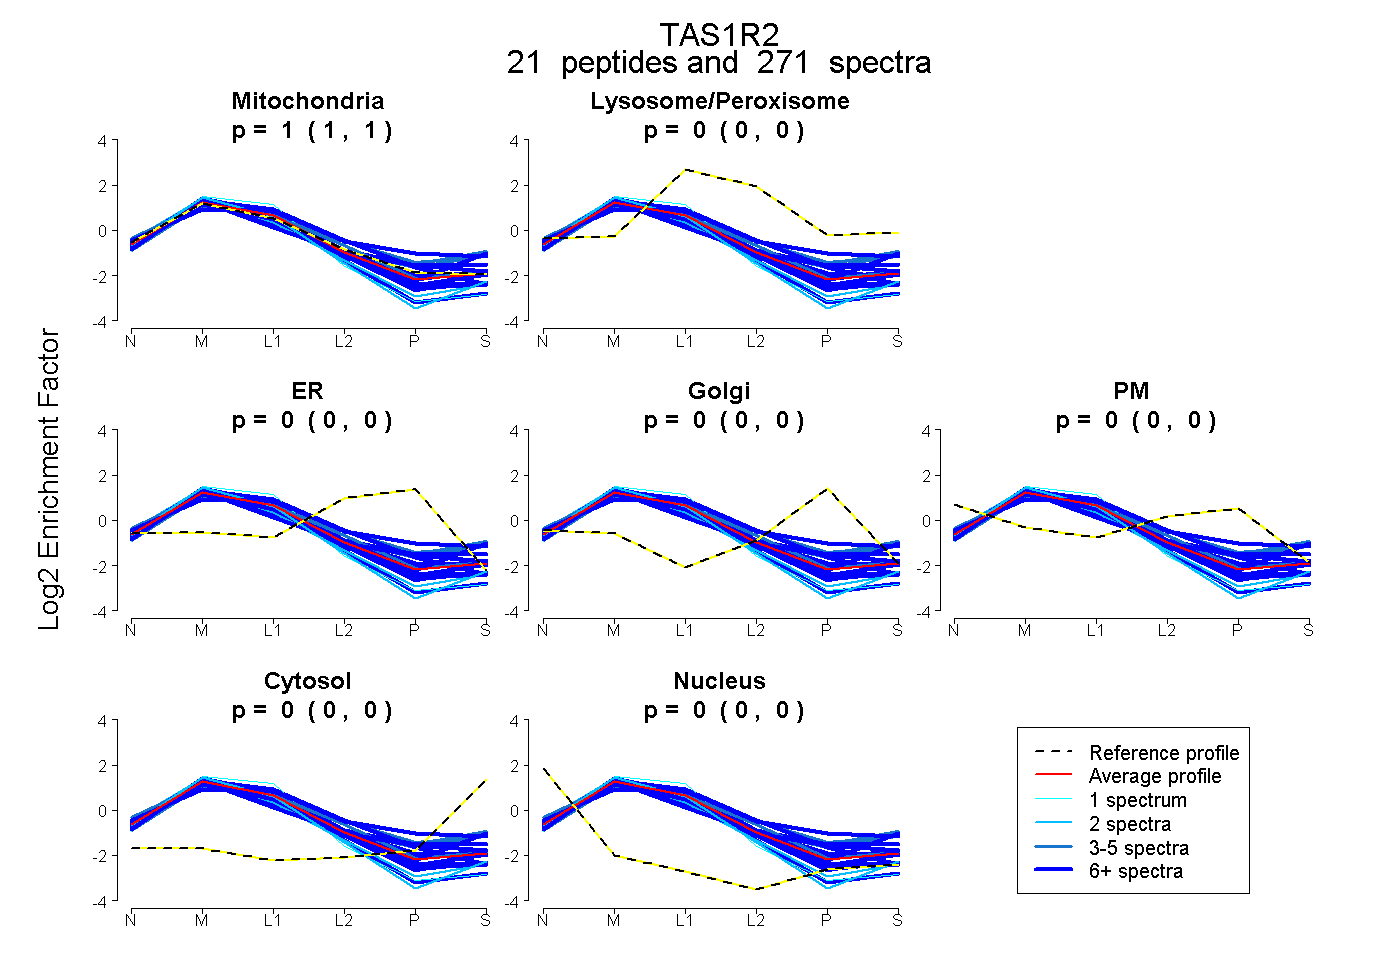 |
1.000 1.000 | 1.000 |
0.000 0.000 | 0.000 |
0.000 0.000 | 0.000 |
0.000 0.000 | 0.000 |
0.000 0.000 | 0.000 |
0.000 0.000 | 0.000 |
0.000 0.000 | 0.000 |
|||
| Plot | Lyso | Other | |||||||||||
| Expt C |
27 peptides |
1649 spectra |
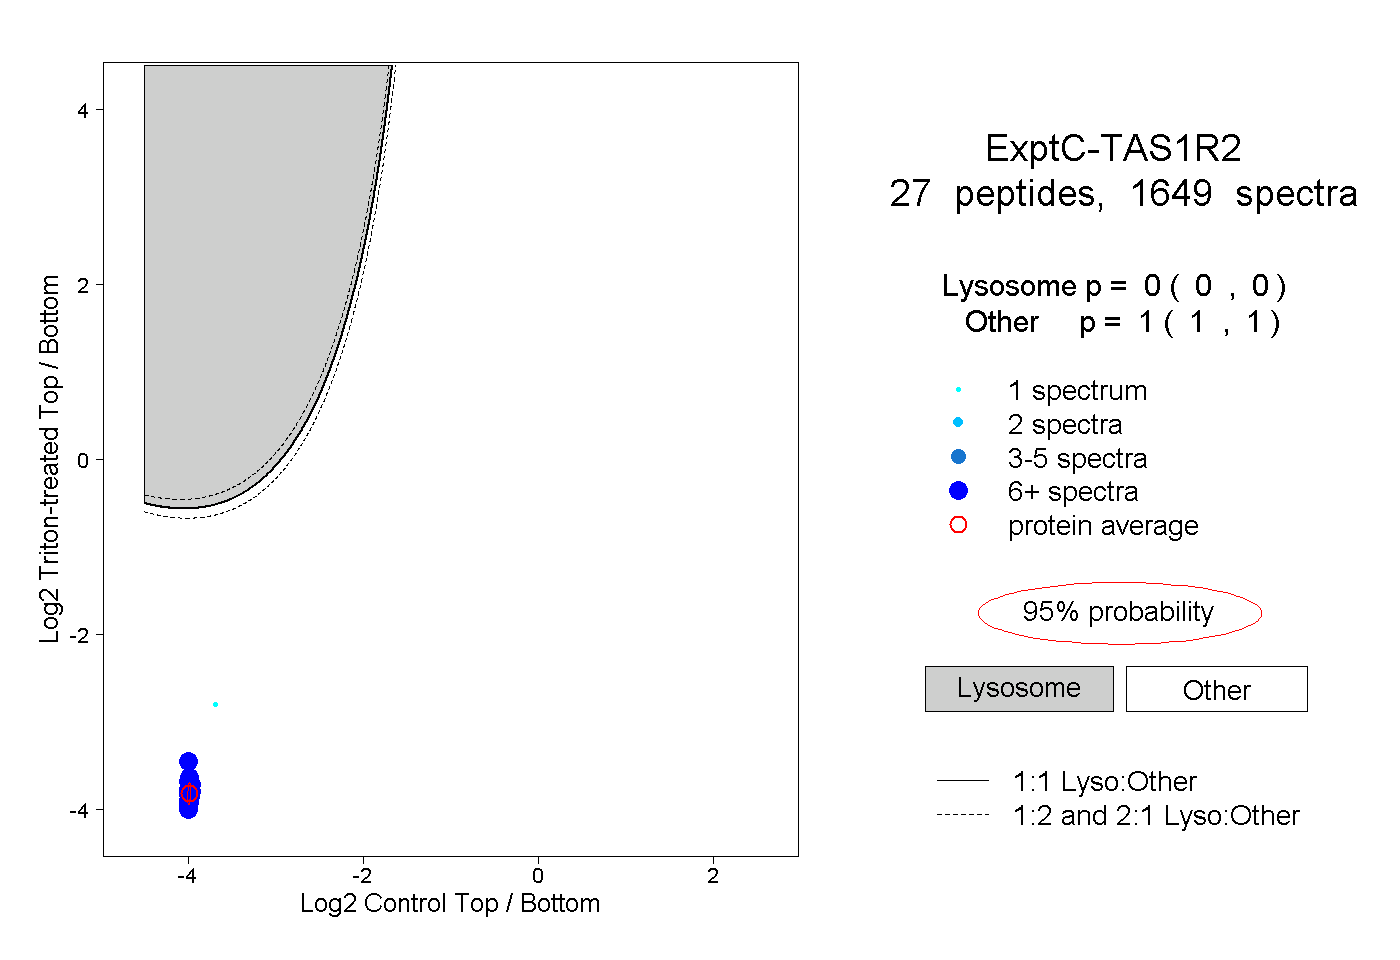 |
0.000 0.000 | 0.000 |
1.000 1.000 | 1.000 |
||||||||
| Plot | Lyso | Other | |||||||||||
| Expt D |
19 peptides |
123 spectra |
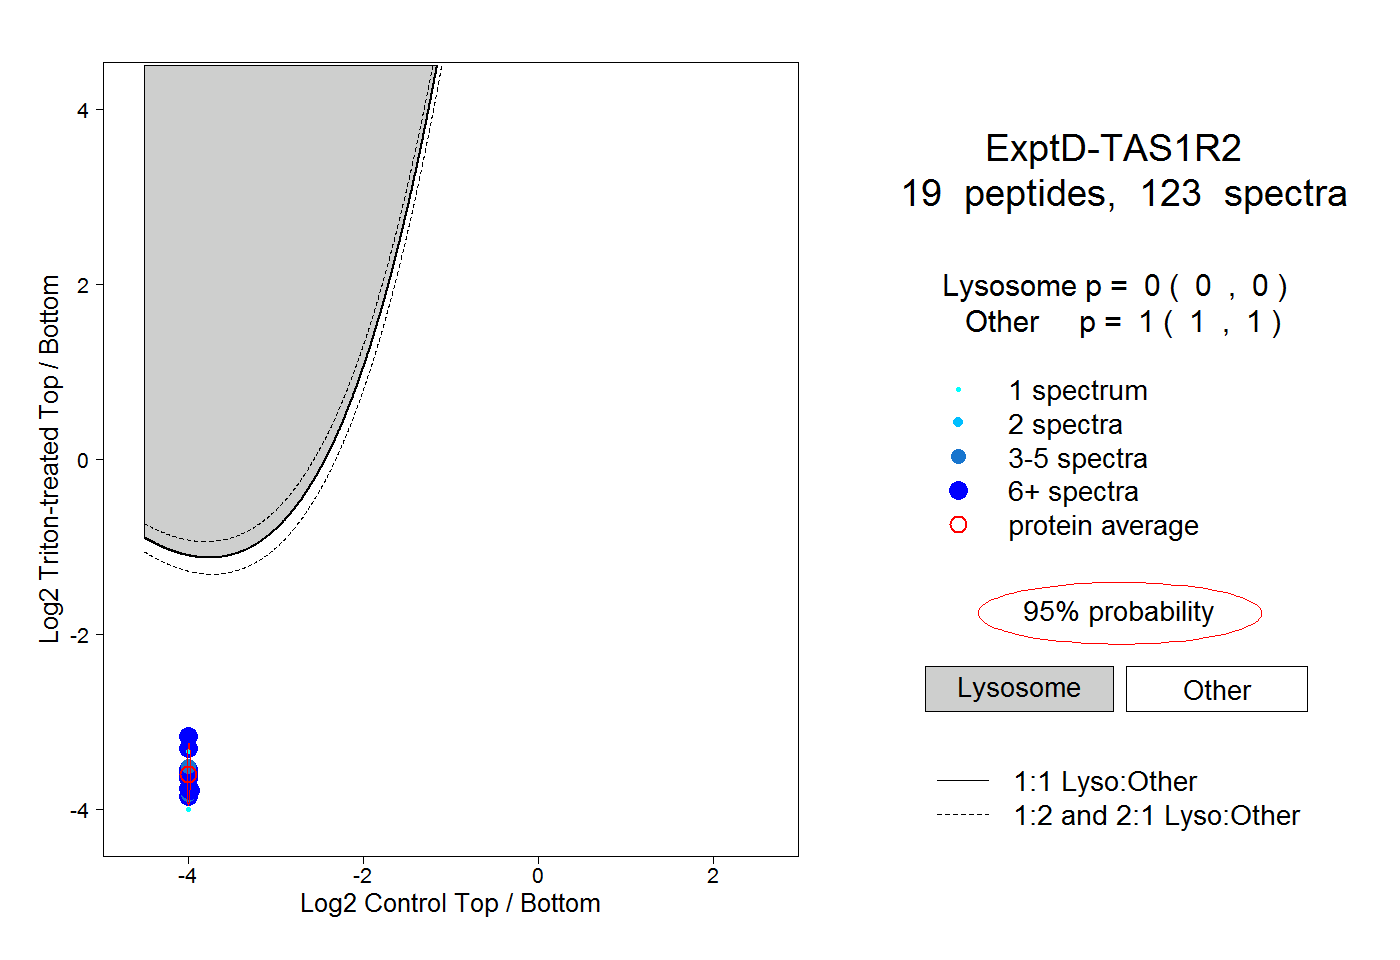 |
0.000 0.000 | 0.000 |
1.000 1.000 | 1.000 |