10
10peptides
spectra
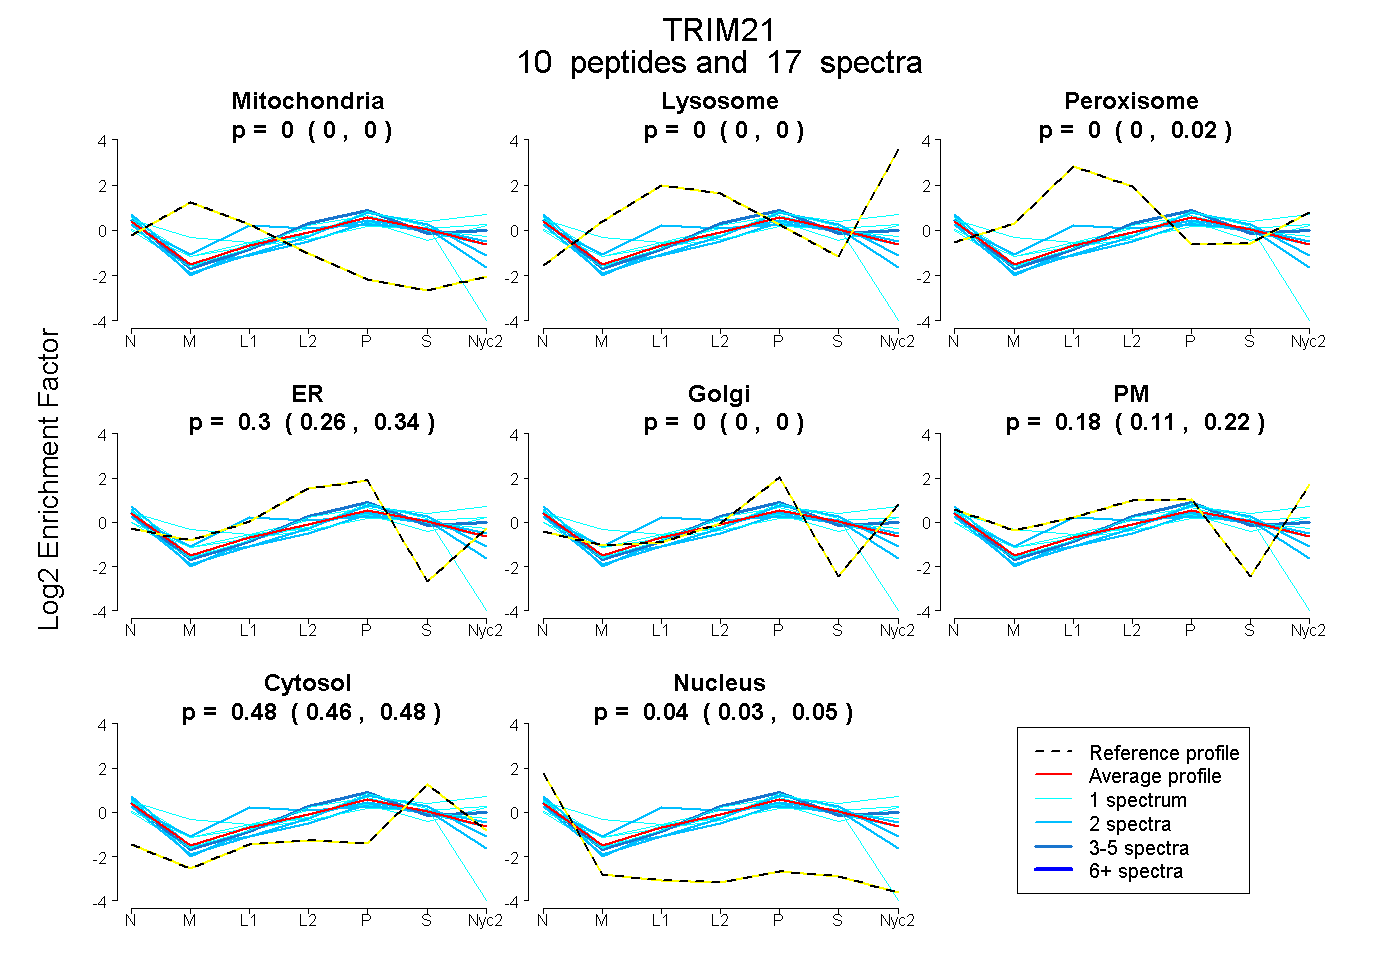
0.000 | 0.000
0.000 | 0.000
0.000 | 0.019
0.255 | 0.342
0.000 | 0.000
0.113 | 0.222
0.462 | 0.482
0.028 | 0.052
3peptides
spectra
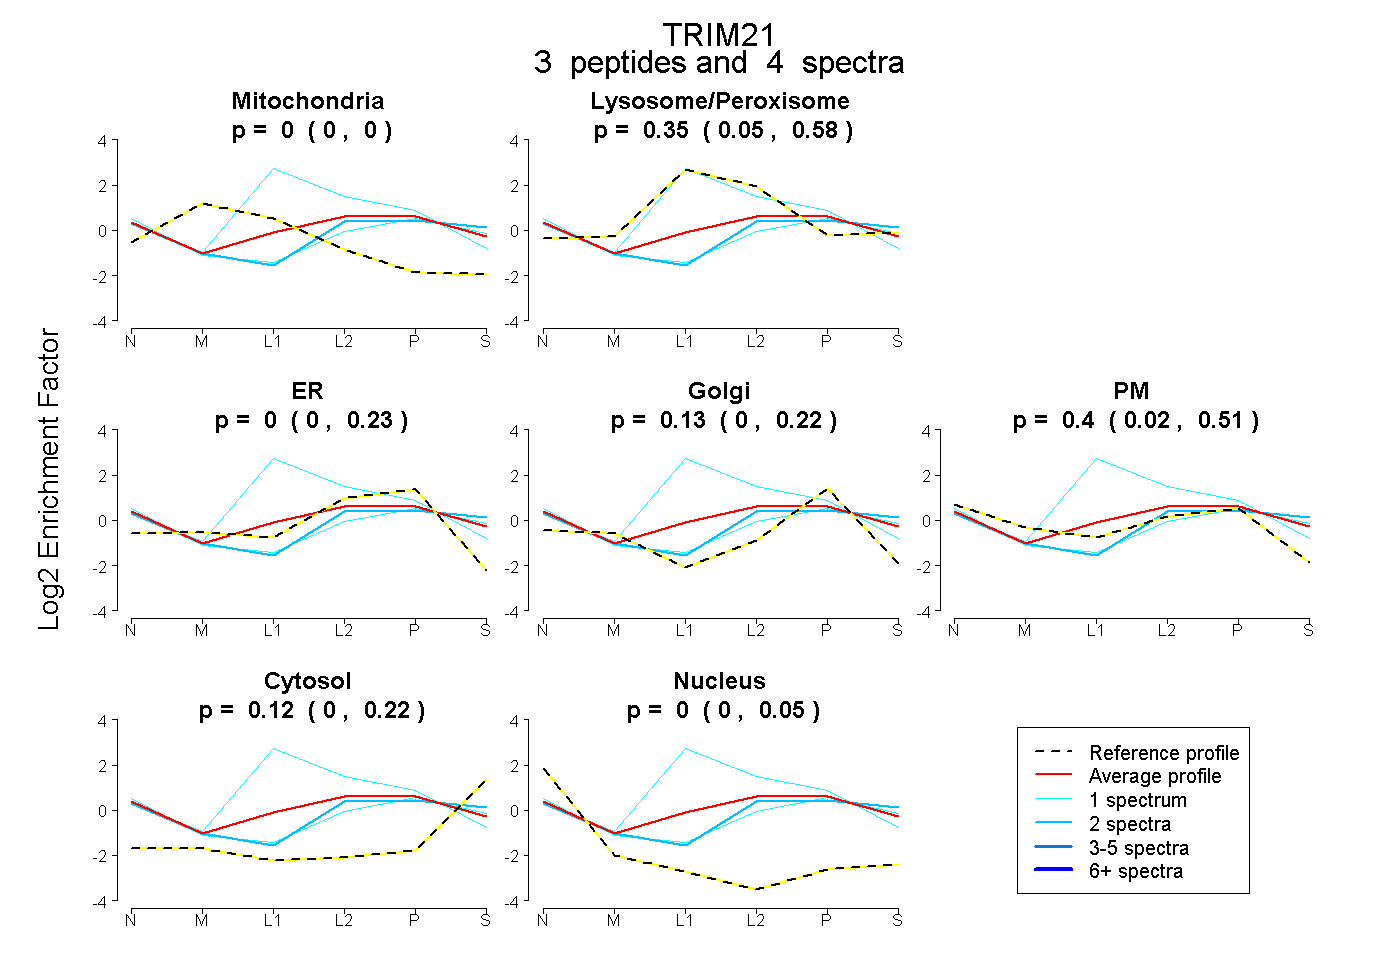
0.000 | 0.000
0.054 | 0.585
0.000 | 0.228
0.000 | 0.222
0.020 | 0.508
0.000 | 0.220
0.000 | 0.048
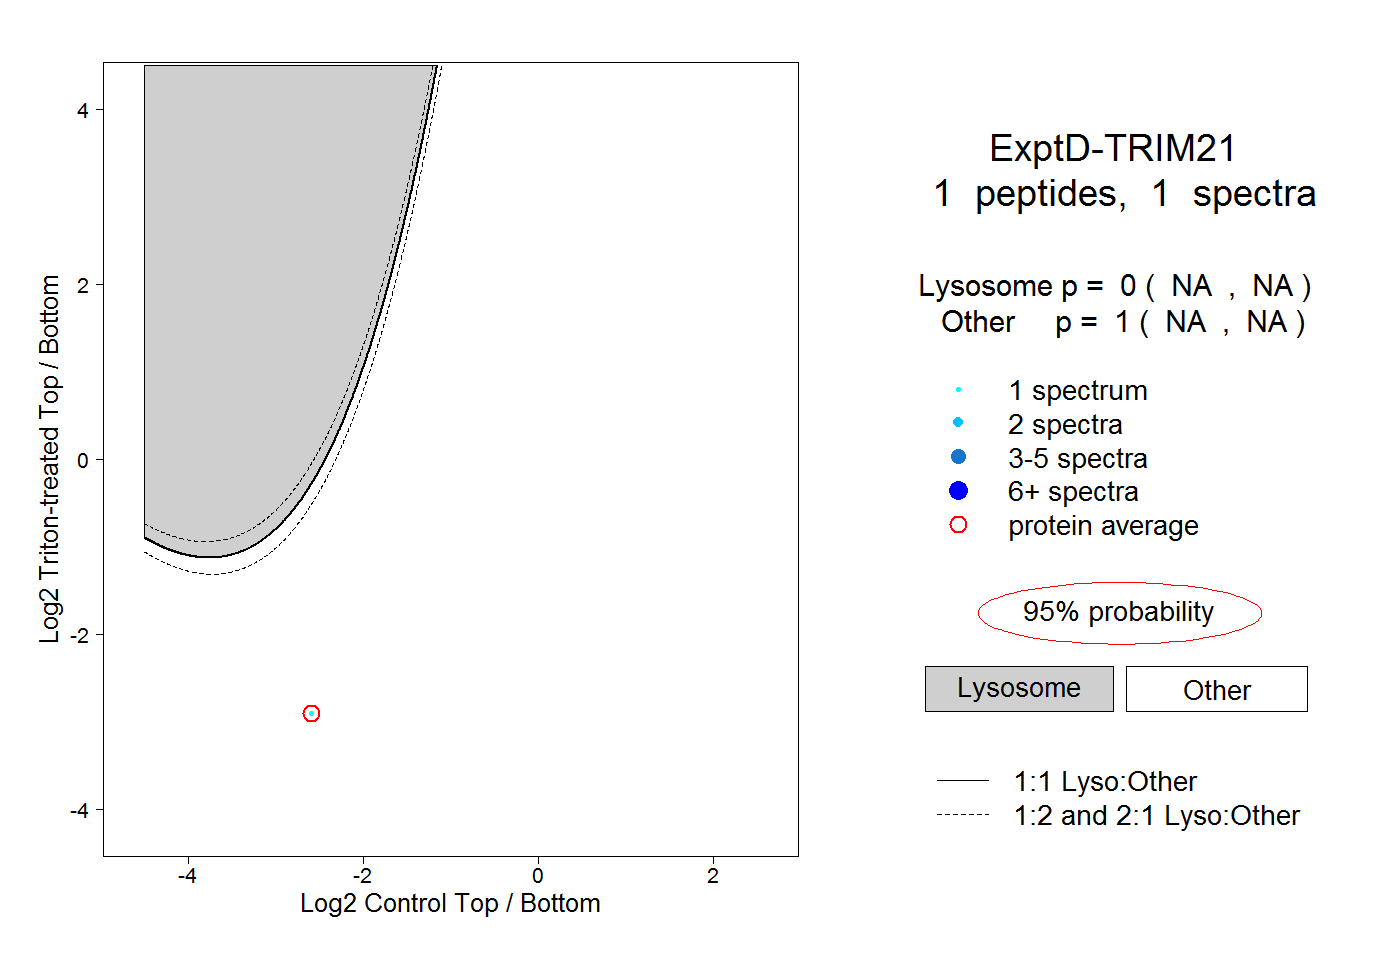
7peptides
spectra
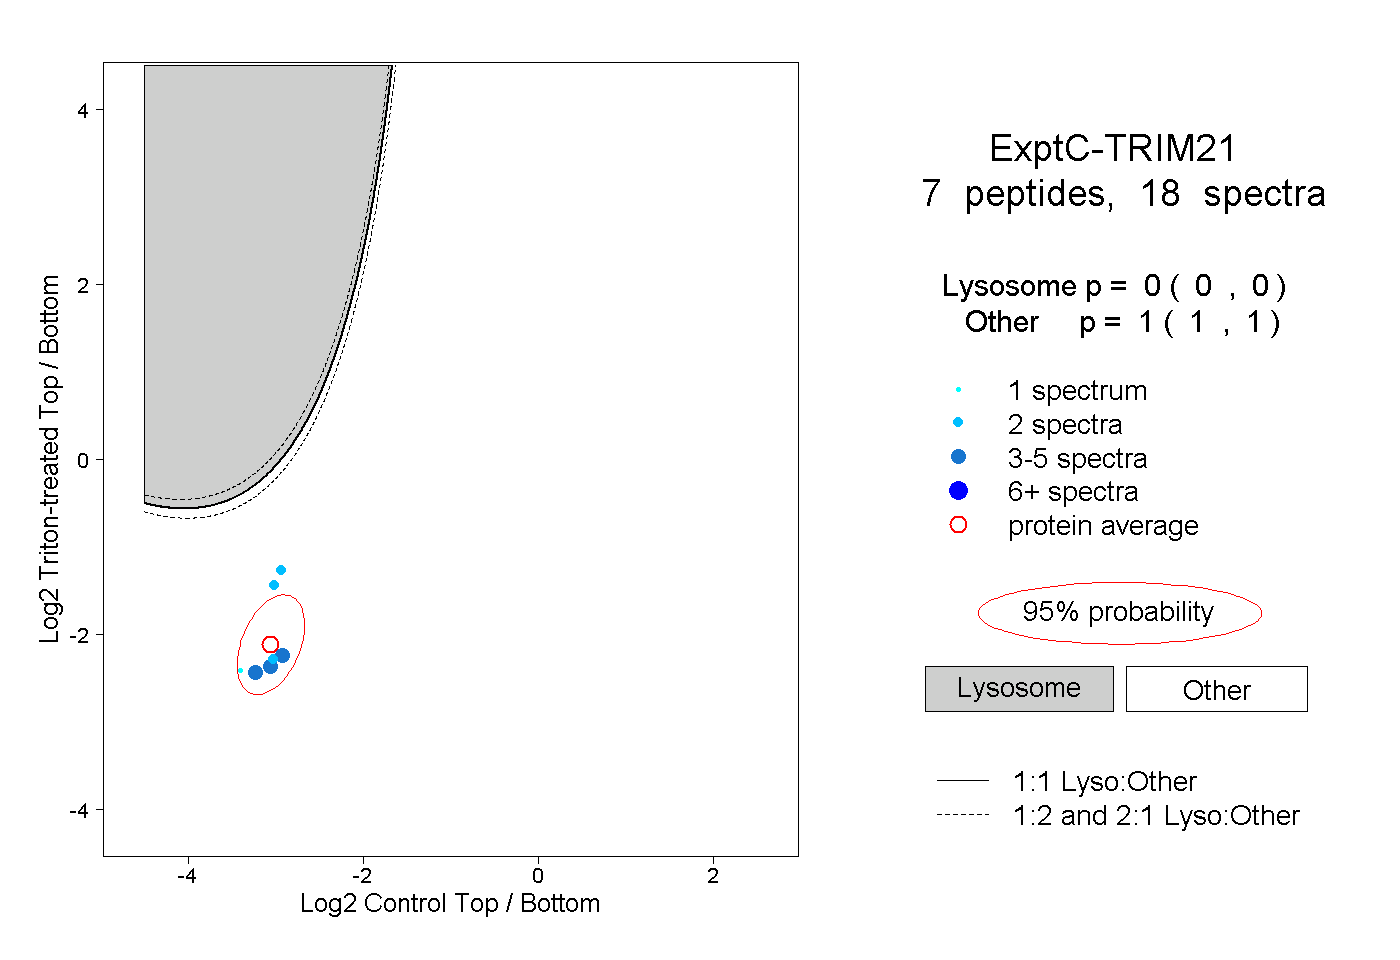
0.000 | 0.000
1.000 | 1.000