TRIM21
[ENSRNOP00000024992]
Main page
| | | Plot |
Mito |
Lyso |
|
Perox |
ER |
Golgi |
PM |
Cytosol |
Nucleus |
|
| Expt A |
 10
10
peptides |
17
spectra |
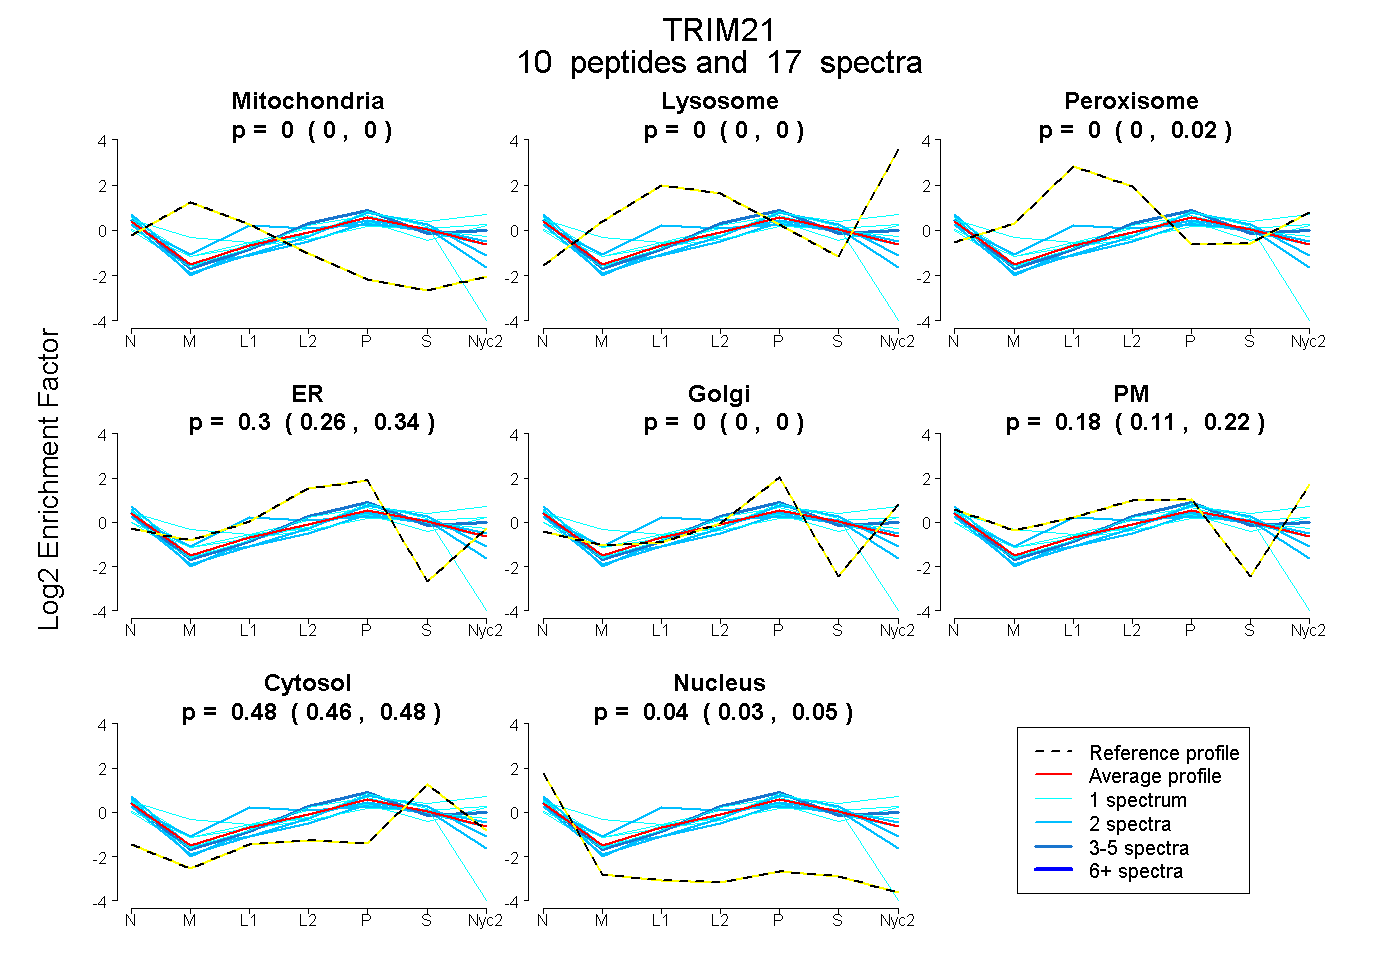 |
0.000
0.000 | 0.000 |
0.000
0.000 | 0.000 |
|
0.001
0.000 | 0.019 |
0.305
0.255 | 0.342 |
0.000
0.000 | 0.000 |
0.179
0.113 | 0.222 |
0.476
0.462 | 0.482 |
0.039
0.028 | 0.052 |
|
| | | Plot |
Mito |
|
Lyso or Perox |
|
ER |
Golgi |
PM |
Cytosol |
Nucleus |
|
| Expt B |
3
peptides |
4
spectra |
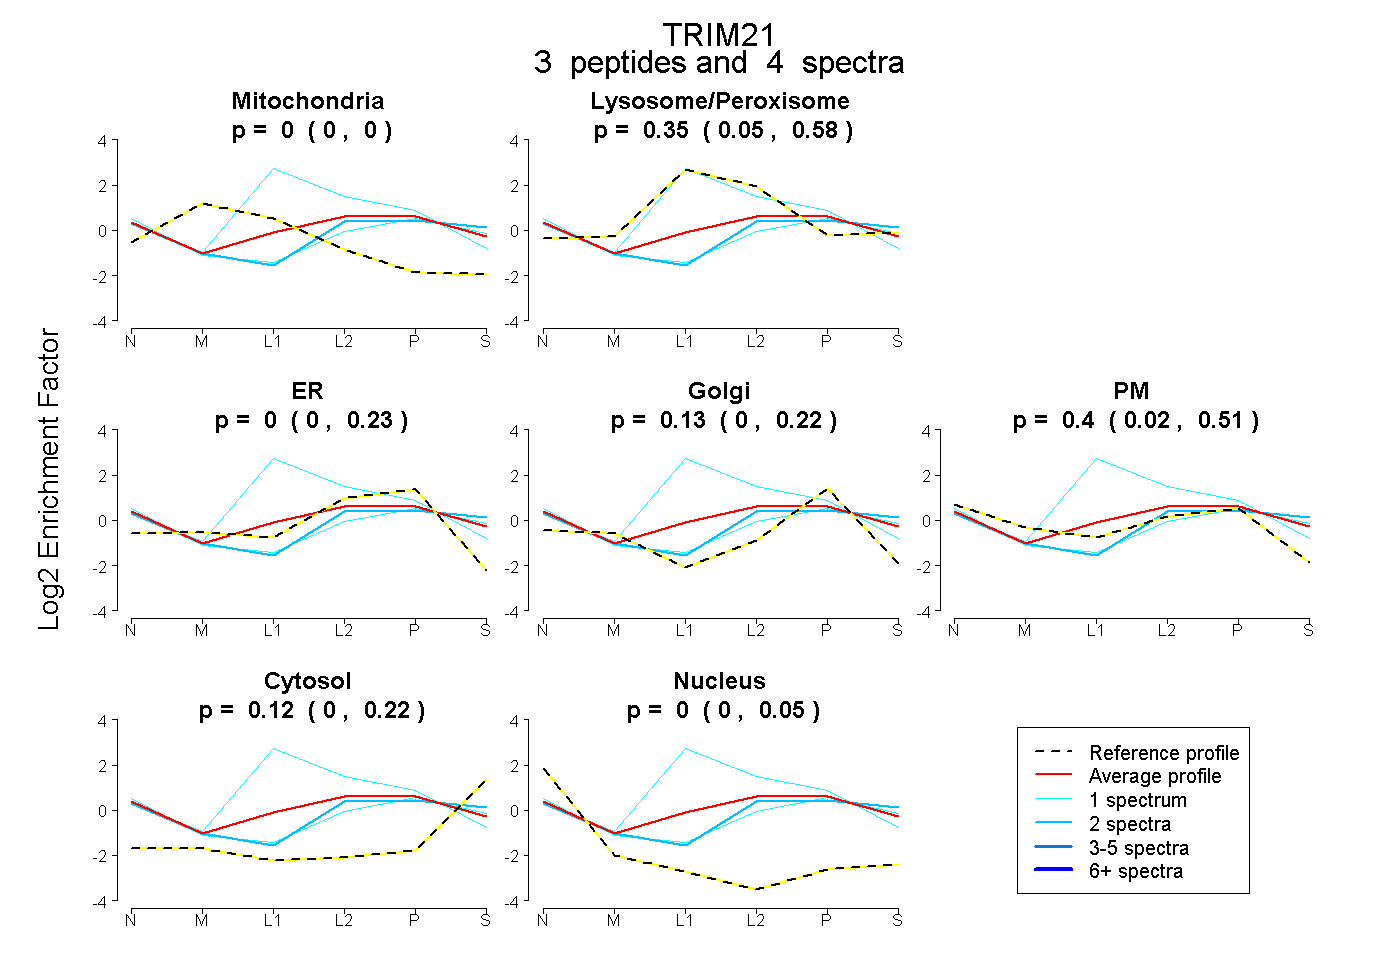 |
0.000
0.000 | 0.000 |
|
0.347
0.054 | 0.585 |
|
0.000
0.000 | 0.228 |
0.128
0.000 | 0.222 |
0.401
0.020 | 0.508 |
0.124
0.000 | 0.220 |
0.000
0.000 | 0.048 |
|
| 2 spectra, NQALQELISELER |
0.000 |
|
0.059 |
|
0.155 |
0.000 |
0.476 |
0.310 |
0.000 |
|
| 1 spectrum, NIDTQK |
0.000 |
|
0.821 |
|
0.115 |
0.000 |
0.063 |
0.000 |
0.000 |
|
| 1 spectrum, GSELELLK |
0.000 |
|
0.029 |
|
0.000 |
0.041 |
0.660 |
0.270 |
0.000 |
|
| | | Plot |
|
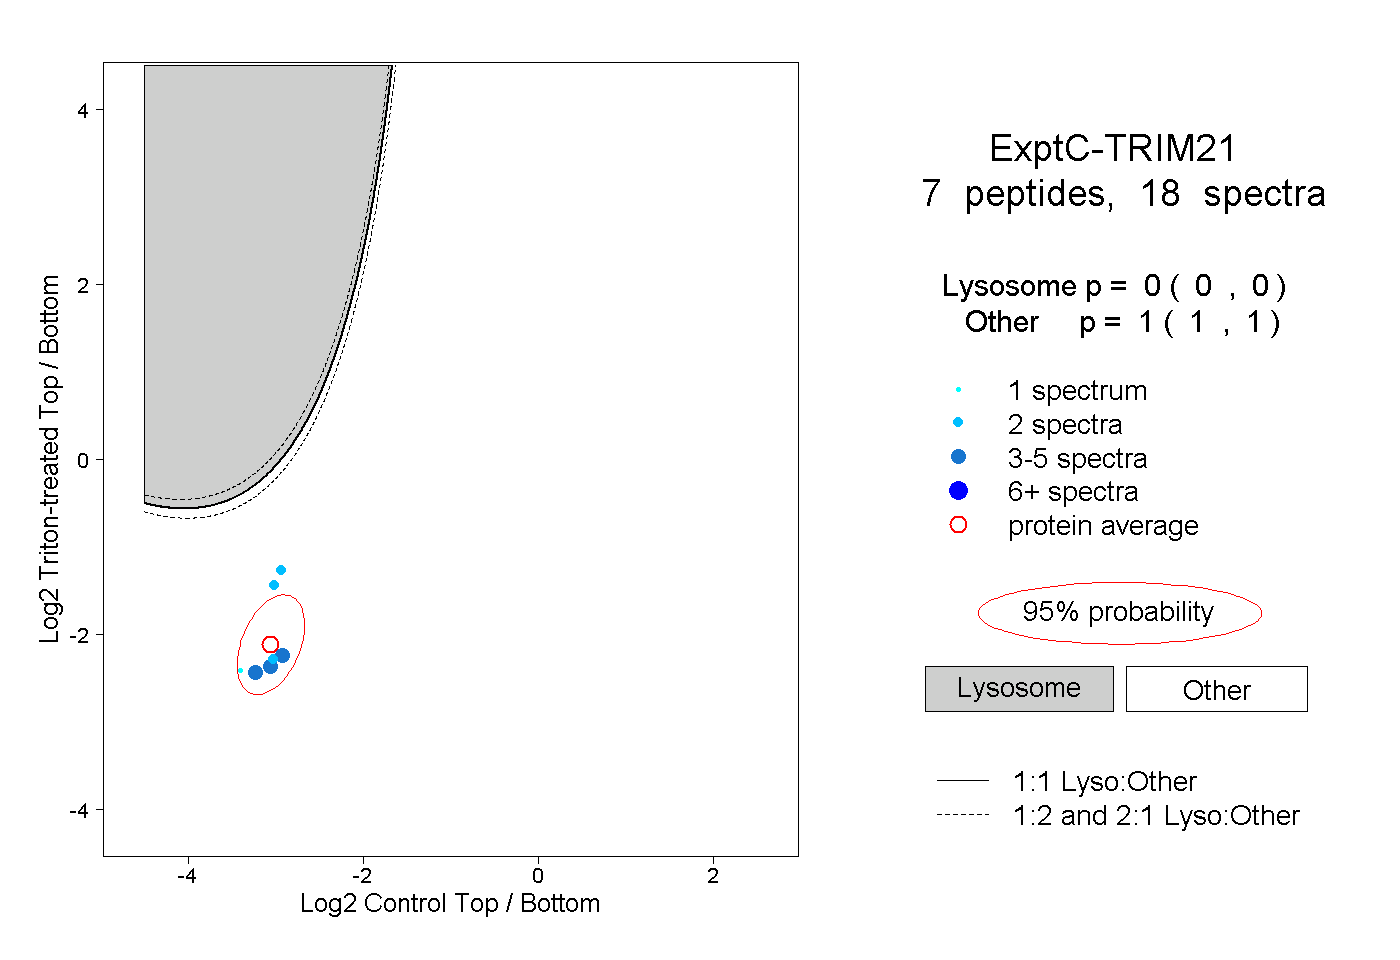
Lyso |
|
|
|
|
|
|
|
Other |
| Expt C |
7
peptides |
18
spectra |
 |
|
0.000
0.000 | 0.000 |
|
|
|
|
|
|
|
1.000
1.000 | 1.000 |
| | | Plot |
|
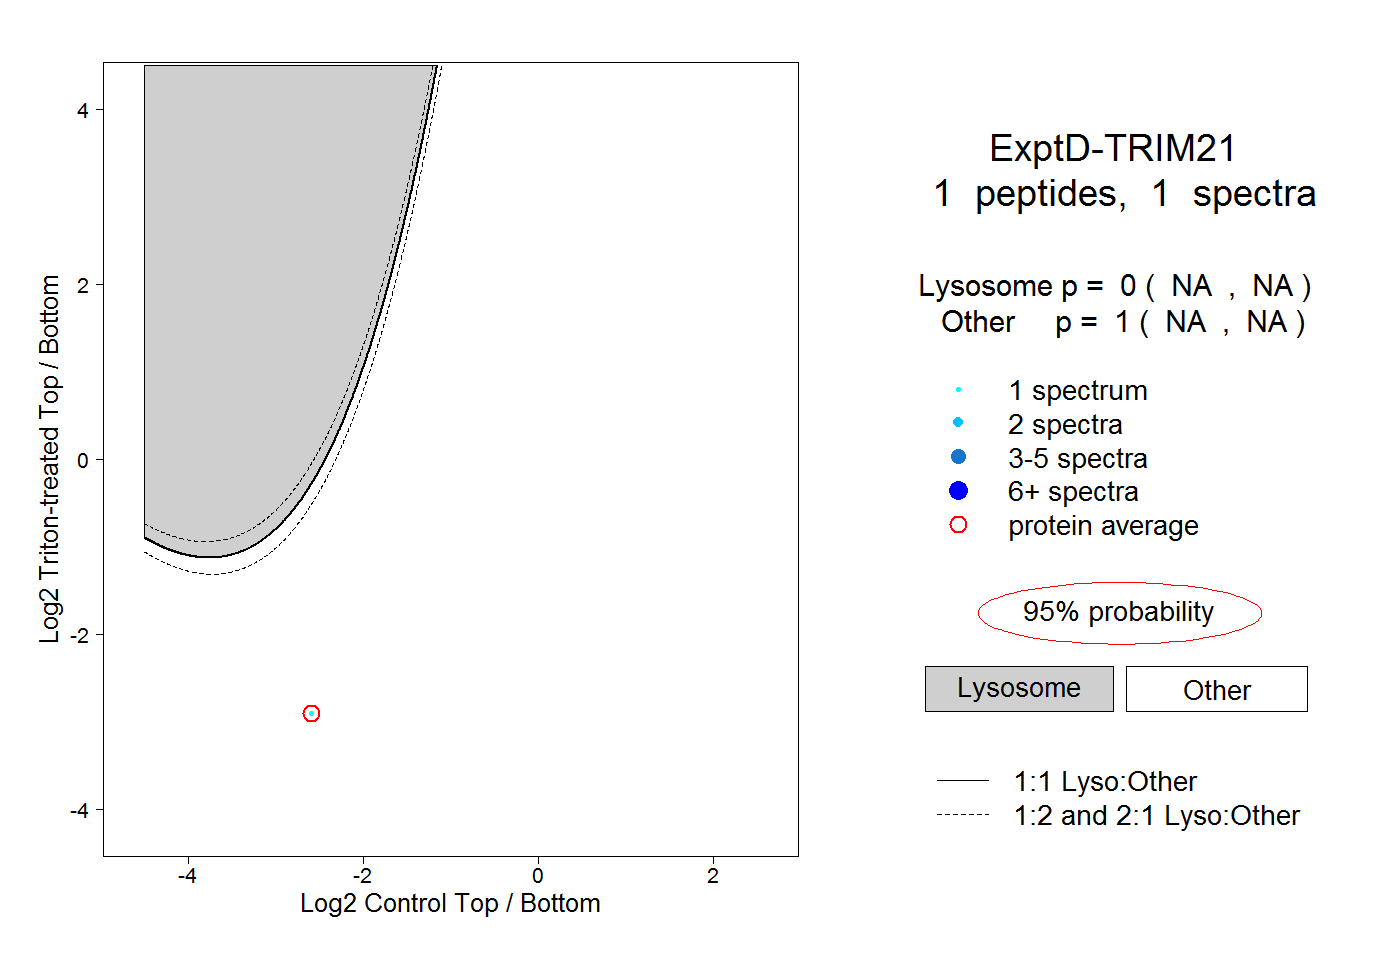
Lyso |
|
|
|
|
|
|
|
Other |
| Expt D |
1
peptide |
1
spectrum |
 |
|
0.000
NA | NA |
|
|
|
|
|
|
|
1.000
NA | NA |