 10
10peptides
spectra
0.000 | 0.000
0.000 | 0.000
0.000 | 0.019
0.255 | 0.342
0.000 | 0.000
0.113 | 0.222
0.462 | 0.482
0.028 | 0.052
| Plot | Mito | Lyso | Perox | ER | Golgi | PM | Cytosol | Nucleus | |||||
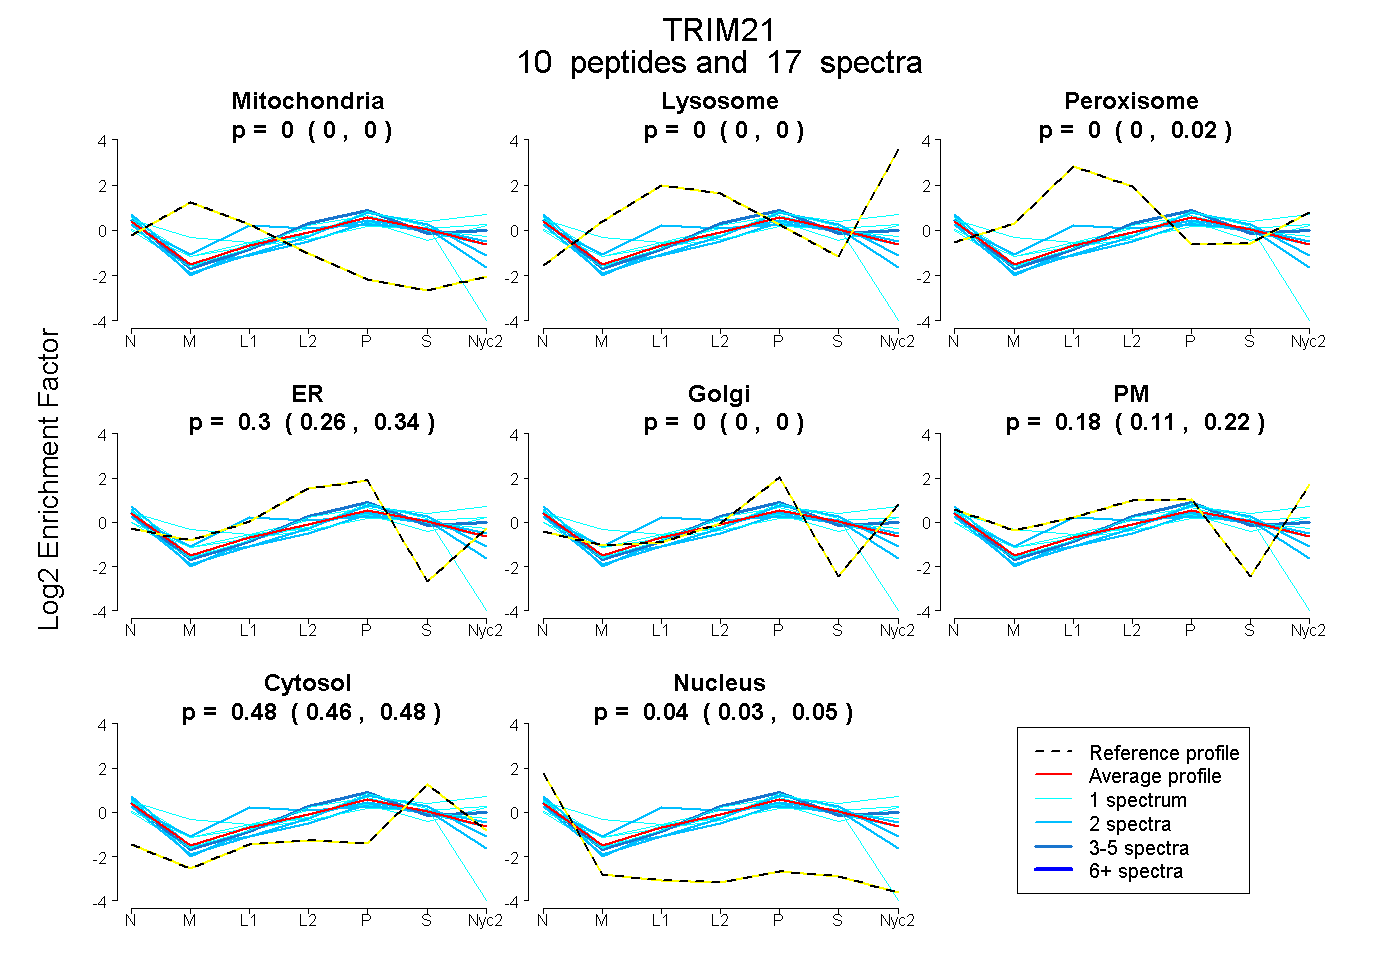
| Expt A |
10 peptides |
17 spectra |
|
0.000 0.000 | 0.000 |
0.000 0.000 | 0.000 |
0.001 0.000 | 0.019 |
0.305 0.255 | 0.342 |
0.000 0.000 | 0.000 |
0.179 0.113 | 0.222 |
0.476 0.462 | 0.482 |
0.039 0.028 | 0.052 |
| 1 spectrum, FNNYPMVLGAQR | 0.080 | 0.000 | 0.021 | 0.002 | 0.000 | 0.556 | 0.341 | 0.000 | ||
| 1 spectrum, MYWEVDVTQK | 0.000 | 0.036 | 0.000 | 0.000 | 0.122 | 0.348 | 0.493 | 0.000 | ||
| 1 spectrum, HIANMVENLK | 0.000 | 0.000 | 0.000 | 0.000 | 0.000 | 0.494 | 0.483 | 0.023 | ||
| 1 spectrum, VPIEEAAK | 0.081 | 0.000 | 0.000 | 0.374 | 0.000 | 0.000 | 0.371 | 0.173 | ||
| 2 spectra, EAELAEK | 0.000 | 0.000 | 0.000 | 0.137 | 0.023 | 0.277 | 0.445 | 0.119 | ||
| 2 spectra, QAWDLGVCR | 0.000 | 0.000 | 0.000 | 0.397 | 0.021 | 0.000 | 0.526 | 0.057 | ||
| 1 spectrum, NQALQELISELER | 0.000 | 0.000 | 0.000 | 0.259 | 0.000 | 0.269 | 0.462 | 0.011 | ||
| 4 spectra, MGDTYQNVSENAER | 0.000 | 0.000 | 0.000 | 0.242 | 0.056 | 0.269 | 0.433 | 0.000 | ||
| 2 spectra, GSELELLK | 0.000 | 0.000 | 0.000 | 0.221 | 0.000 | 0.231 | 0.495 | 0.053 | ||
| 2 spectra, IHEEFAHQNSLLAQEEQR | 0.000 | 0.000 | 0.269 | 0.268 | 0.000 | 0.000 | 0.335 | 0.128 |
| Plot | Mito | Lyso or Perox | ER | Golgi | PM | Cytosol | Nucleus | ||||||
| Expt B |
3 peptides |
4 spectra |
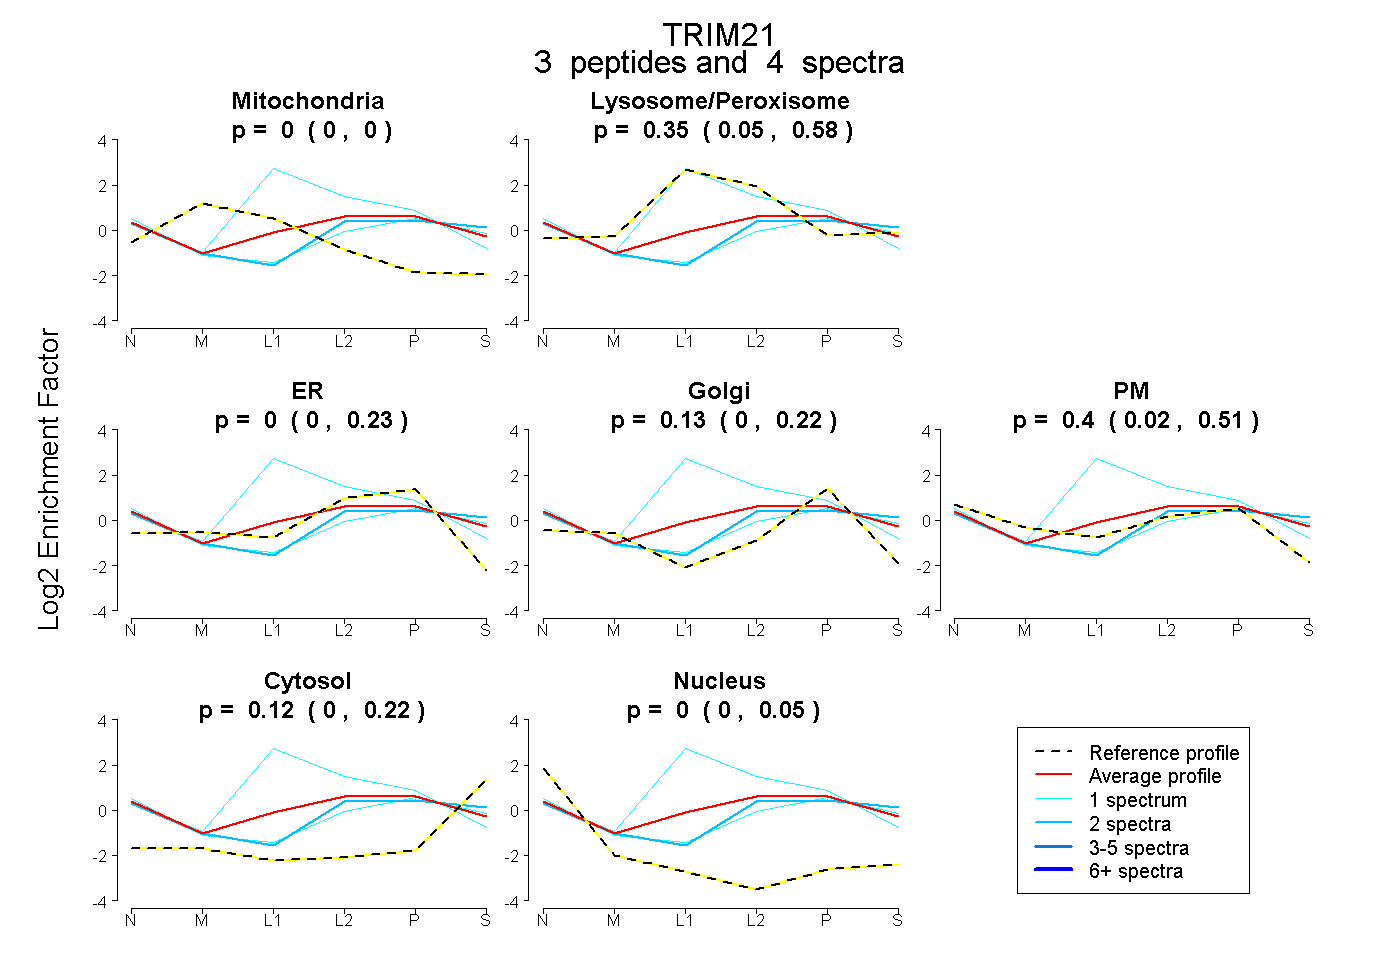 |
0.000 0.000 | 0.000 |
0.347 0.054 | 0.585 |
0.000 0.000 | 0.228 |
0.128 0.000 | 0.222 |
0.401 0.020 | 0.508 |
0.124 0.000 | 0.220 |
0.000 0.000 | 0.048 |
|||
| Plot | Lyso | Other | |||||||||||
| Expt C |
7 peptides |
18 spectra |
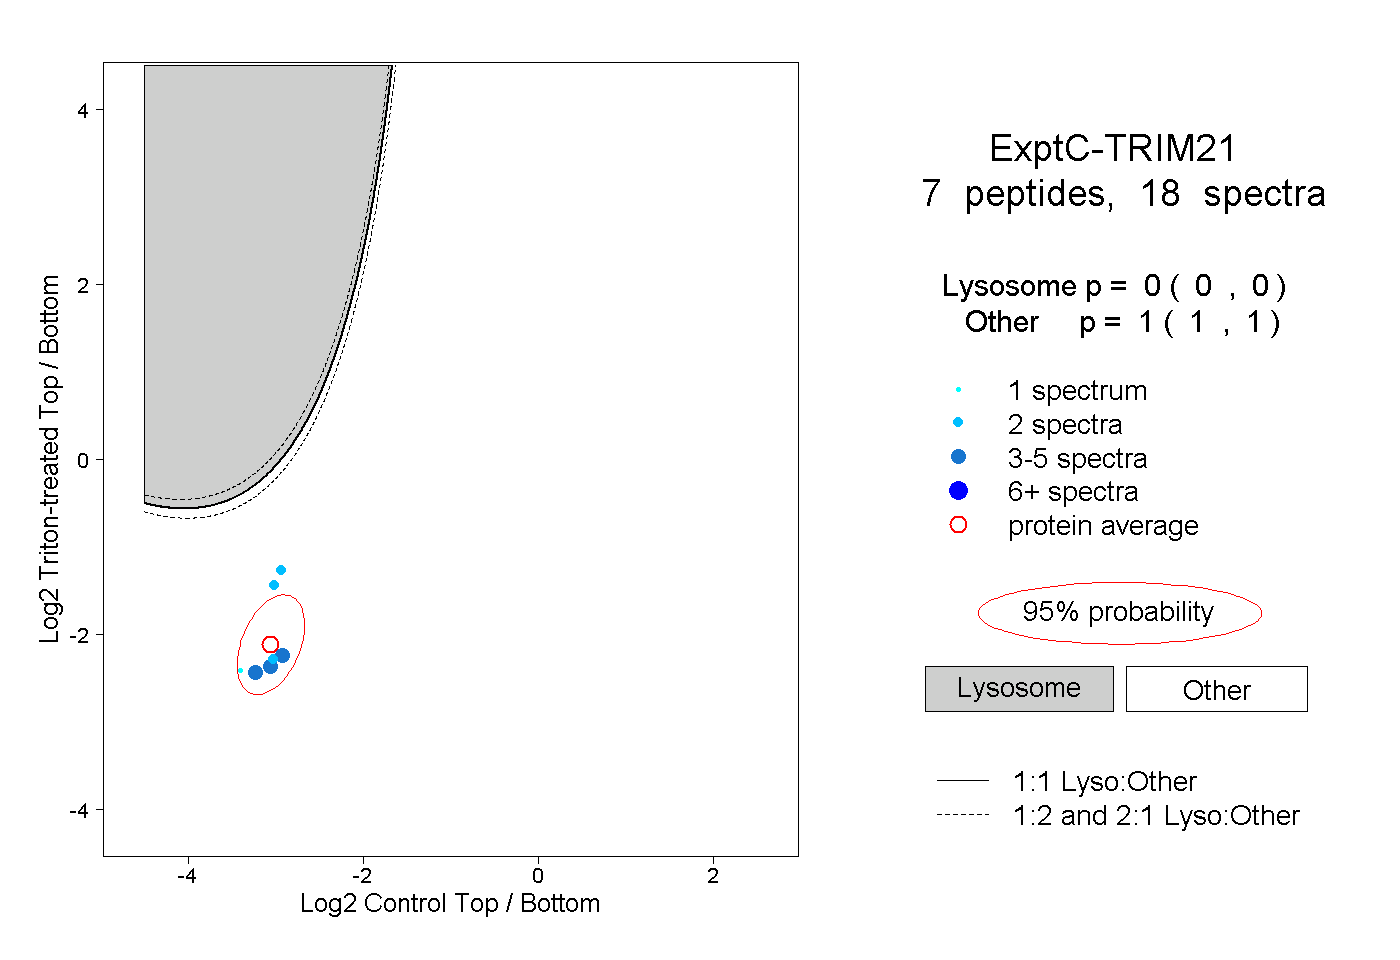 |
0.000 0.000 | 0.000 |
1.000 1.000 | 1.000 |
||||||||
| Plot | Lyso | Other | |||||||||||
| Expt D |
1 peptide |
1 spectrum |
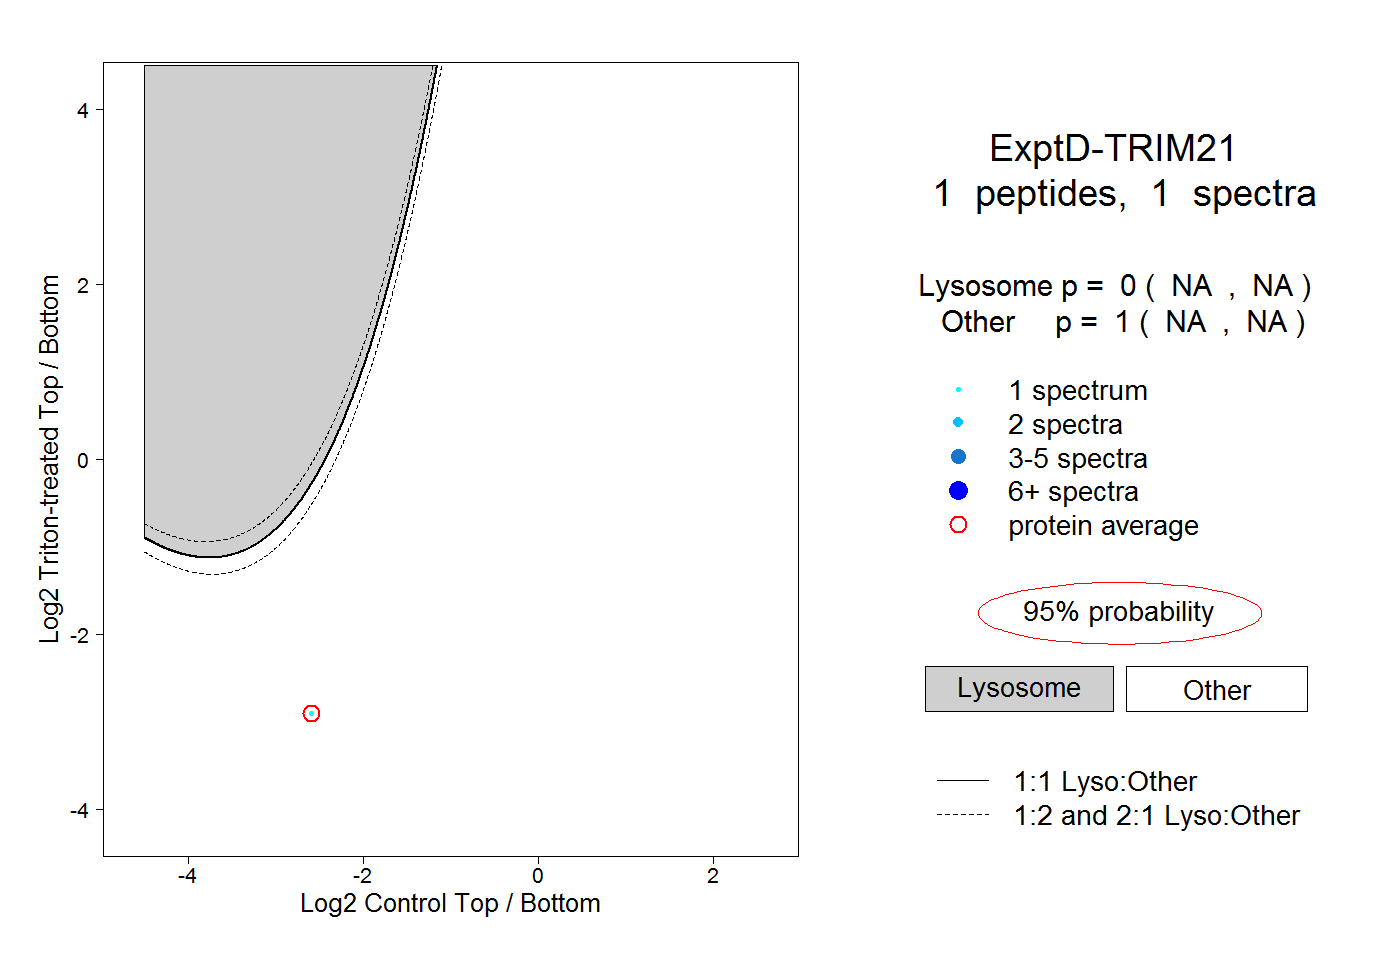 |
0.000 NA | NA |
1.000 NA | NA |