 2
2peptides
spectra
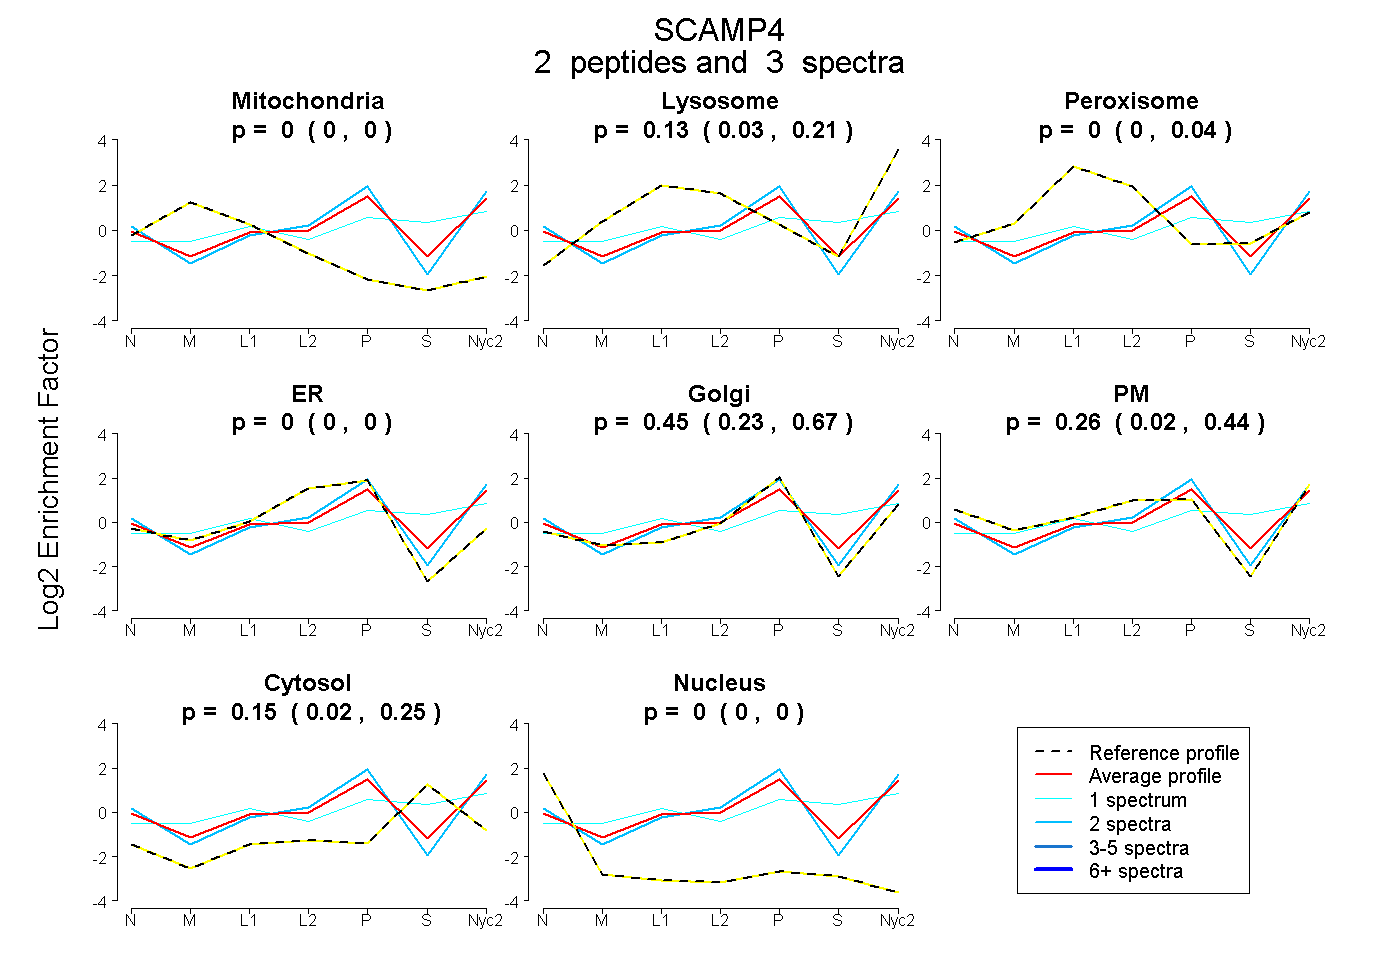
0.000 | 0.000
0.032 | 0.208
0.000 | 0.043
0.000 | 0.000
0.226 | 0.668
0.017 | 0.436
0.024 | 0.246
0.000 | 0.000
1peptide
spectra
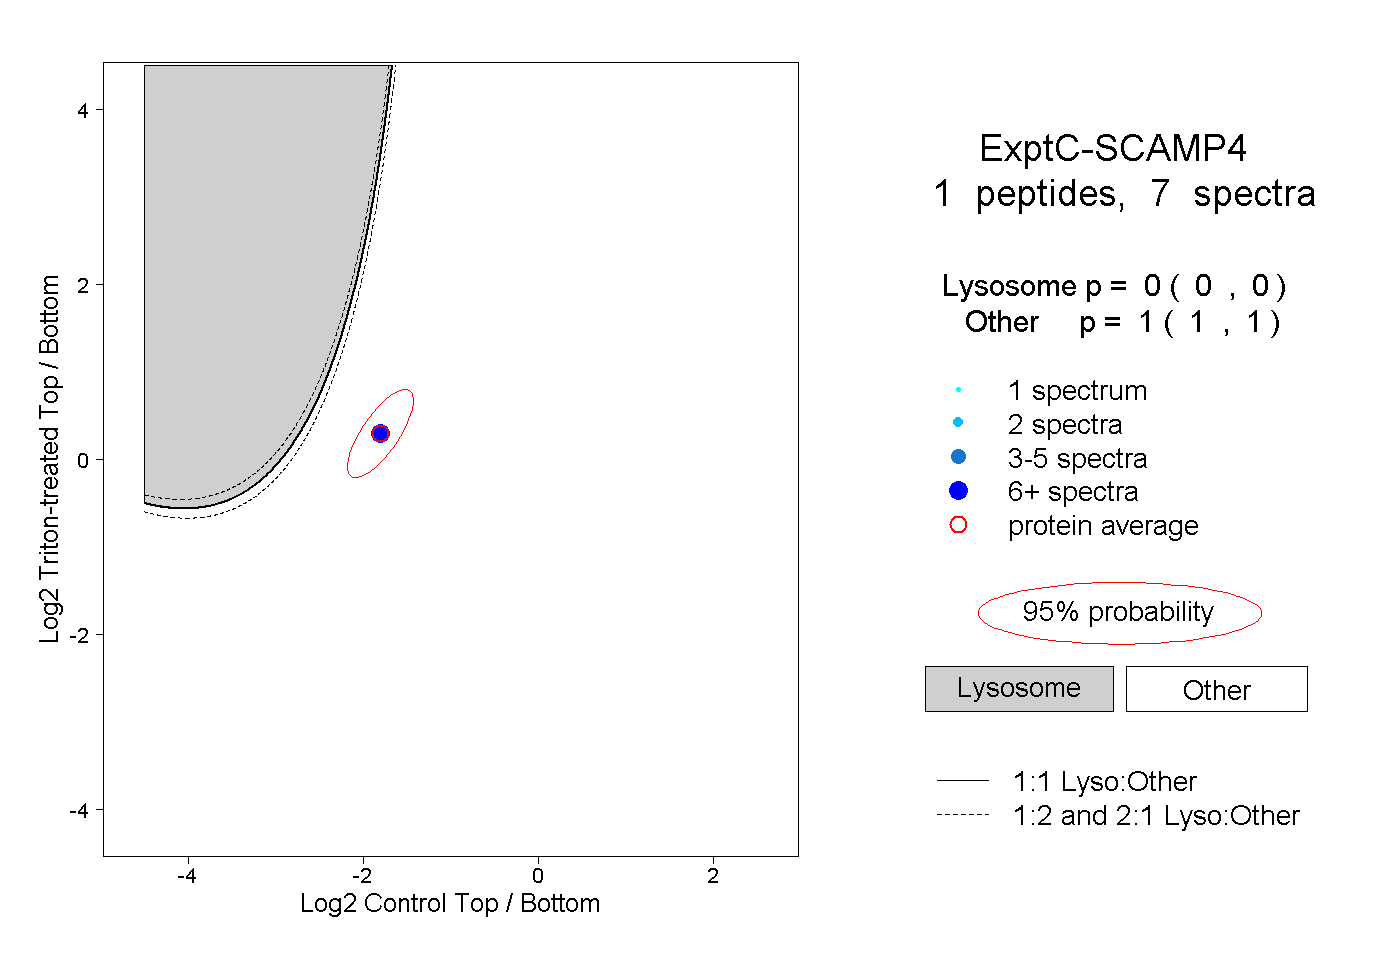
0.000 | 0.000
1.000 | 1.000
| Plot | Mito | Lyso | Perox | ER | Golgi | PM | Cytosol | Nucleus | |||||
| Expt A |
2 peptides |
3 spectra |
|
0.000 0.000 | 0.000 |
0.135 0.032 | 0.208 |
0.000 0.000 | 0.043 |
0.000 0.000 | 0.000 |
0.453 0.226 | 0.668 |
0.259 0.017 | 0.436 |
0.153 0.024 | 0.246 |
0.000 0.000 | 0.000 |
||
| Plot | Lyso | Other | |||||||||||
| Expt C |
1 peptide |
7 spectra |
|
0.000 0.000 | 0.000 |
1.000 1.000 | 1.000 |