 5
5peptides
spectra
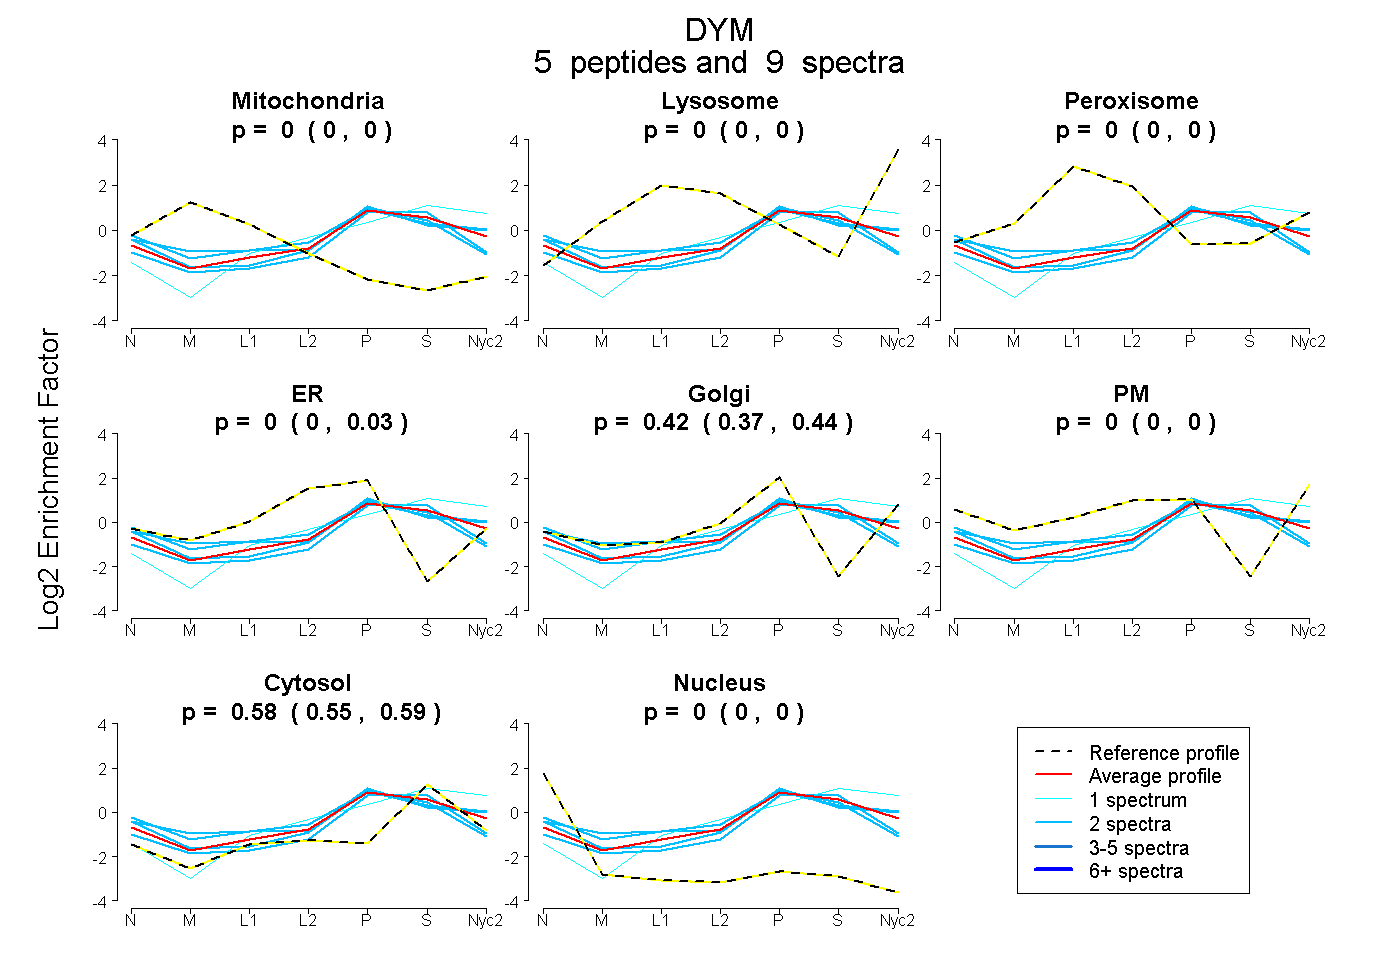
0.000 | 0.000
0.000 | 0.000
0.000 | 0.005
0.000 | 0.032
0.370 | 0.440
0.000 | 0.000
0.553 | 0.593
0.000 | 0.000
1peptide
spectrum
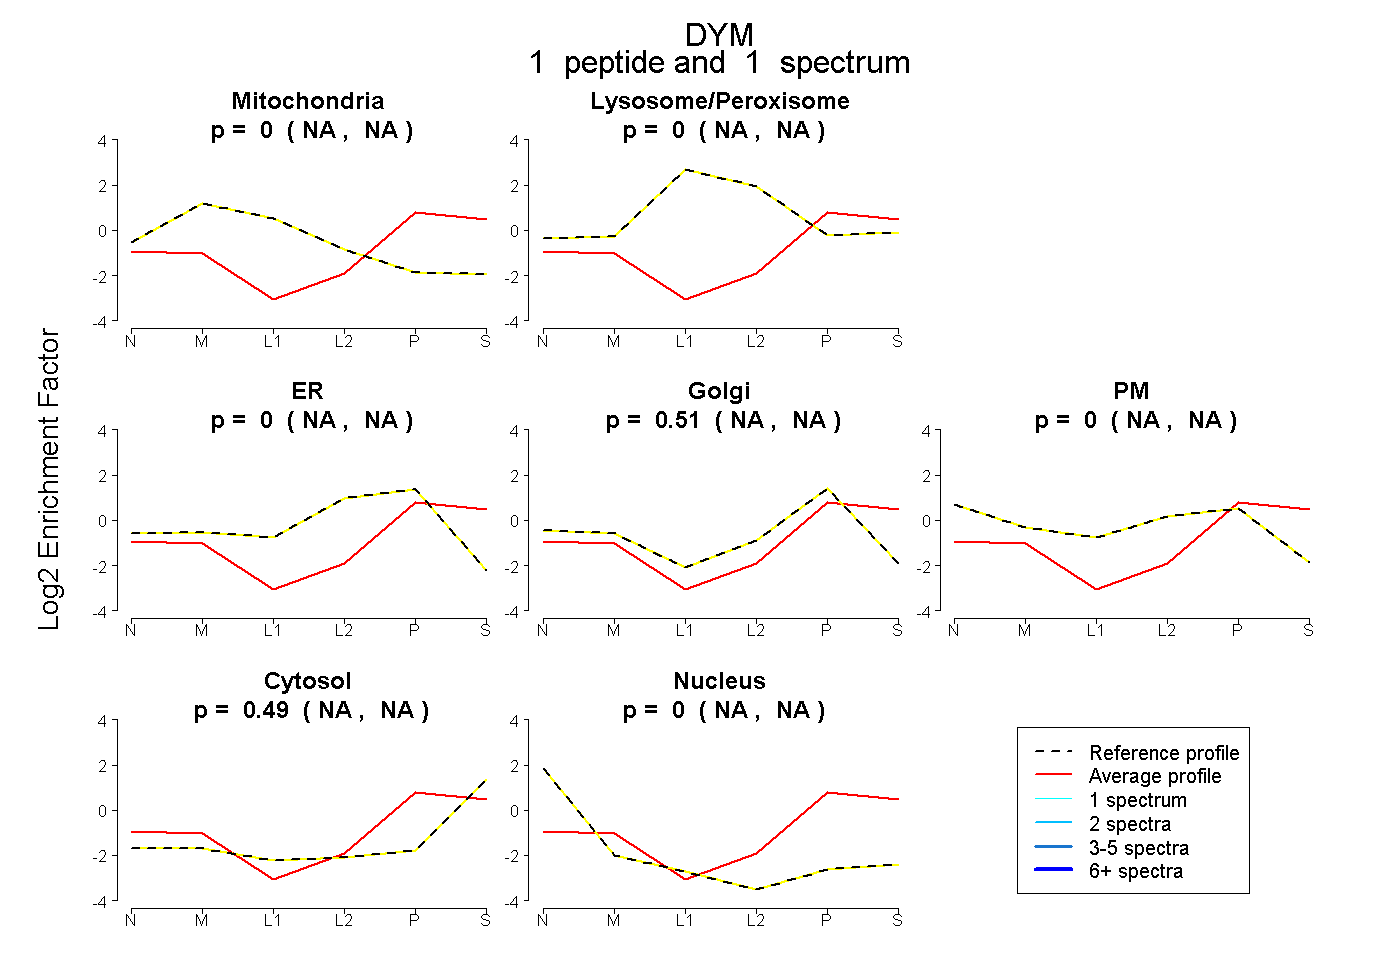
NA | NA
NA | NA
NA | NA
NA | NA
NA | NA
NA | NA
NA | NA
2peptides
spectra
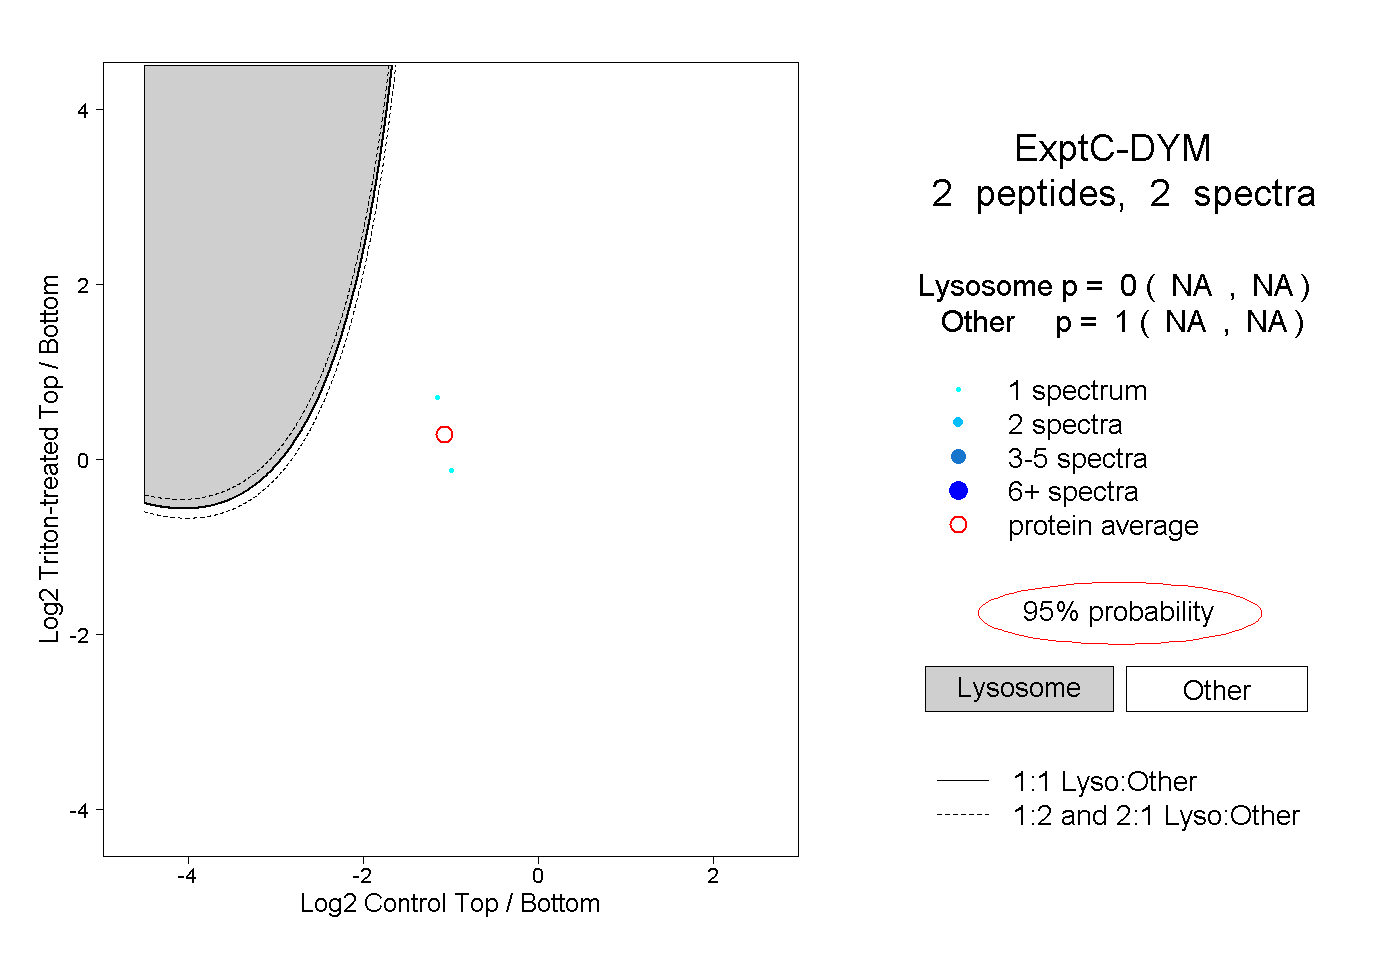
NA | NA
NA | NA