 11
11peptides
spectra
0.000 | 0.000
0.373 | 0.382
0.000 | 0.000
0.159 | 0.180
0.224 | 0.244
0.000 | 0.000
0.214 | 0.221
0.000 | 0.000
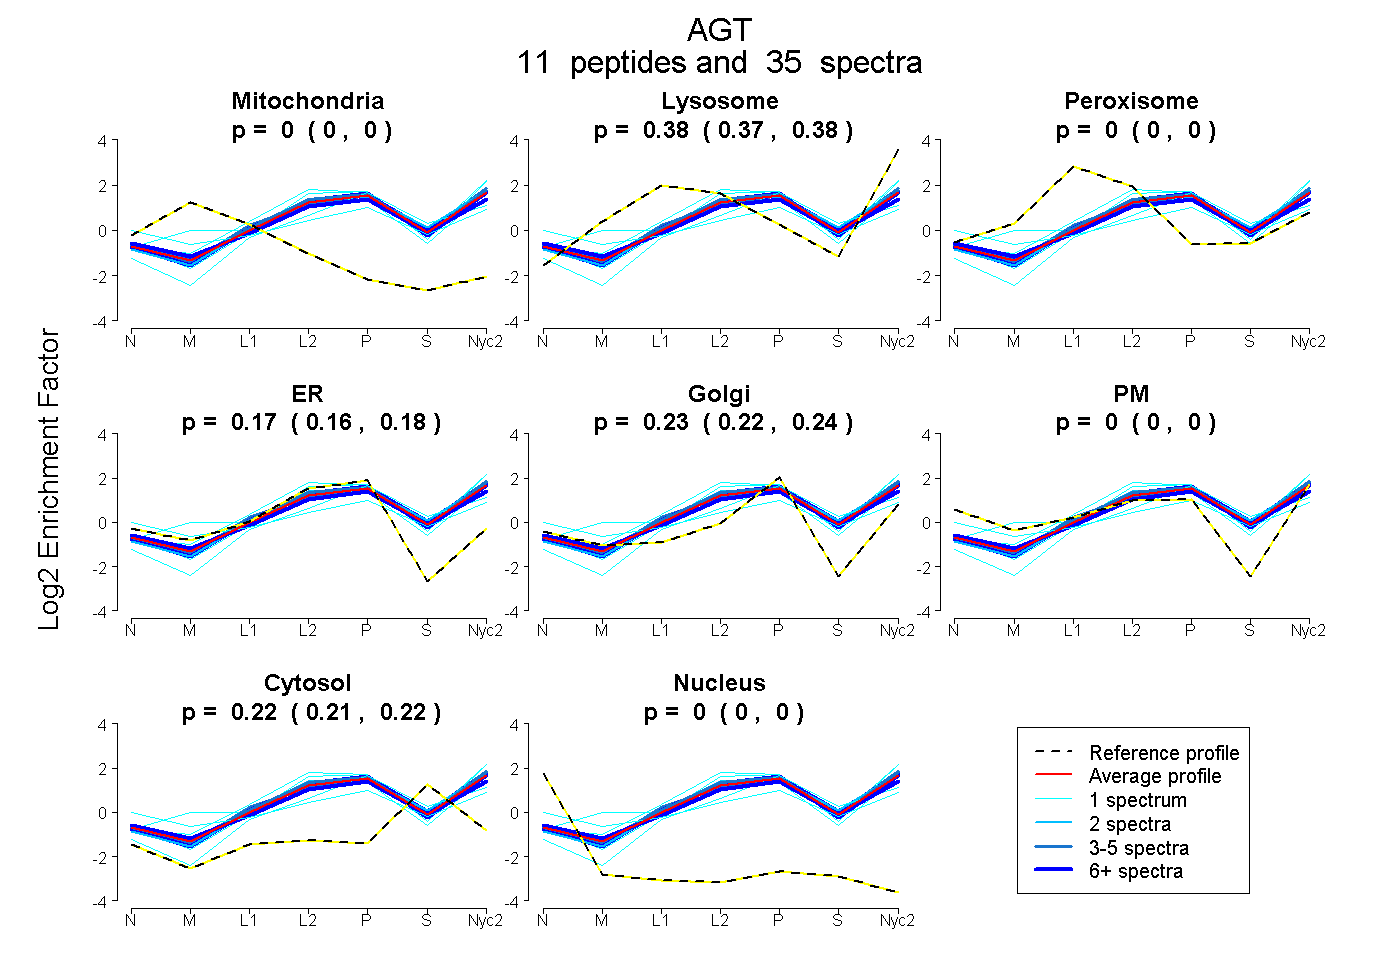
| Plot | Mito | Lyso | Perox | ER | Golgi | PM | Cytosol | Nucleus | |||||
| Expt A |
11 peptides |
35 spectra |
|
0.000 0.000 | 0.000 |
0.378 0.373 | 0.382 |
0.000 0.000 | 0.000 |
0.170 0.159 | 0.180 |
0.234 0.224 | 0.244 |
0.000 0.000 | 0.000 |
0.218 0.214 | 0.221 |
0.000 0.000 | 0.000 |
| 6 spectra, LTLPQLEIR | 0.000 | 0.389 | 0.000 | 0.173 | 0.203 | 0.000 | 0.234 | 0.000 | ||
| 1 spectrum, AAQVAMIANFMGFR | 0.000 | 0.413 | 0.000 | 0.100 | 0.332 | 0.000 | 0.155 | 0.000 | ||
| 2 spectra, LVLATEK | 0.000 | 0.407 | 0.000 | 0.166 | 0.180 | 0.000 | 0.246 | 0.000 | ||
| 6 spectra, TSPVDEK | 0.000 | 0.330 | 0.000 | 0.189 | 0.231 | 0.000 | 0.250 | 0.000 | ||
| 1 spectrum, SLDLSTDPVLAAQK | 0.000 | 0.223 | 0.000 | 0.070 | 0.338 | 0.000 | 0.368 | 0.000 | ||
| 3 spectra, GSYNLQDLLAQAK | 0.000 | 0.421 | 0.000 | 0.096 | 0.260 | 0.000 | 0.223 | 0.000 | ||
| 1 spectrum, VDNPQNVV | 0.000 | 0.058 | 0.119 | 0.000 | 0.196 | 0.350 | 0.276 | 0.000 | ||
| 1 spectrum, LSTLLGAEANLGK | 0.000 | 0.503 | 0.000 | 0.226 | 0.170 | 0.000 | 0.101 | 0.000 | ||
| 10 spectra, MGDTNPR | 0.000 | 0.374 | 0.000 | 0.192 | 0.242 | 0.000 | 0.192 | 0.000 | ||
| 1 spectrum, FVQAVTGWK | 0.000 | 0.447 | 0.000 | 0.211 | 0.220 | 0.000 | 0.122 | 0.000 | ||
| 3 spectra, MLSEAR | 0.000 | 0.405 | 0.000 | 0.182 | 0.218 | 0.000 | 0.196 | 0.000 |
| Plot | Mito | Lyso or Perox | ER | Golgi | PM | Cytosol | Nucleus | ||||||
| Expt B |
5 peptides |
9 spectra |
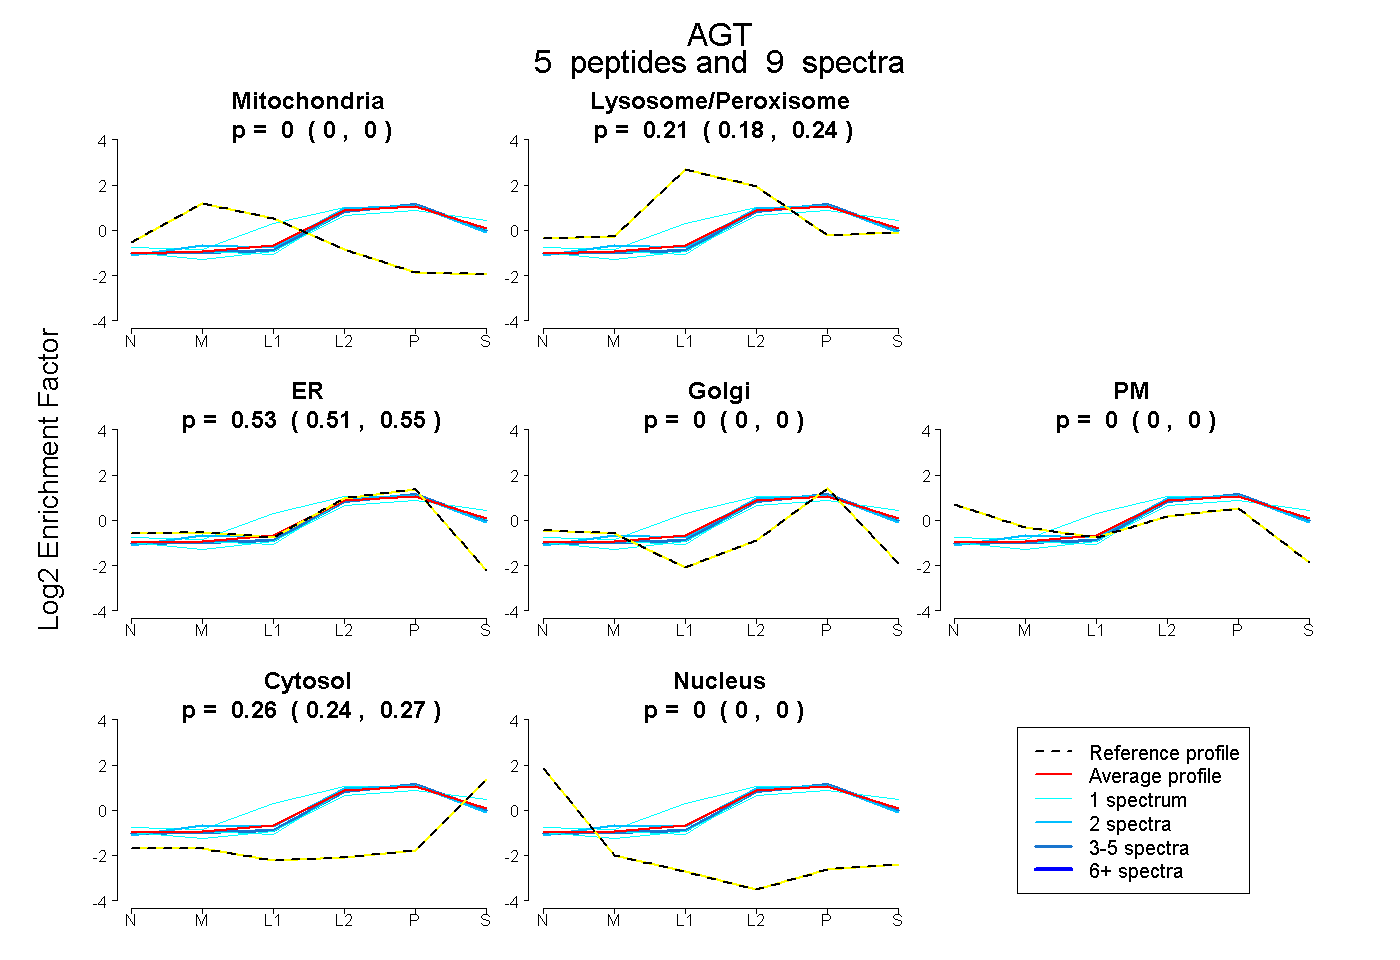 |
0.000 0.000 | 0.000 |
0.215 0.183 | 0.240 |
0.529 0.505 | 0.550 |
0.000 0.000 | 0.000 |
0.000 0.000 | 0.000 |
0.257 0.245 | 0.267 |
0.000 0.000 | 0.000 |
|||
| Plot | Lyso | Other | |||||||||||
| Expt C |
7 peptides |
52 spectra |
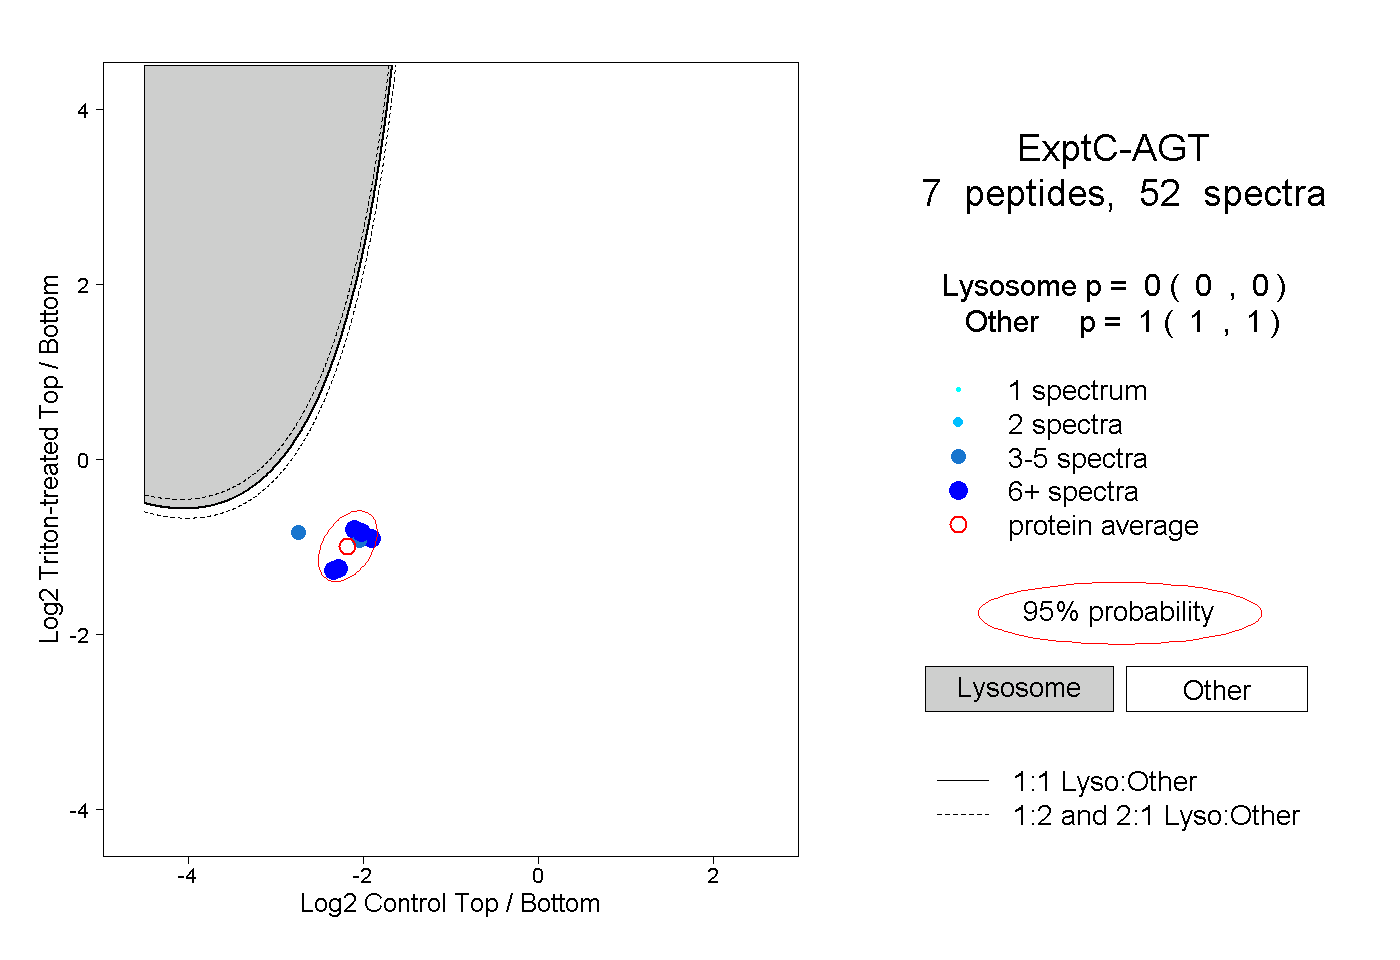 |
0.000 0.000 | 0.000 |
1.000 1.000 | 1.000 |
||||||||
| Plot | Lyso | Other | |||||||||||
| Expt D |
6 peptides |
6 spectra |
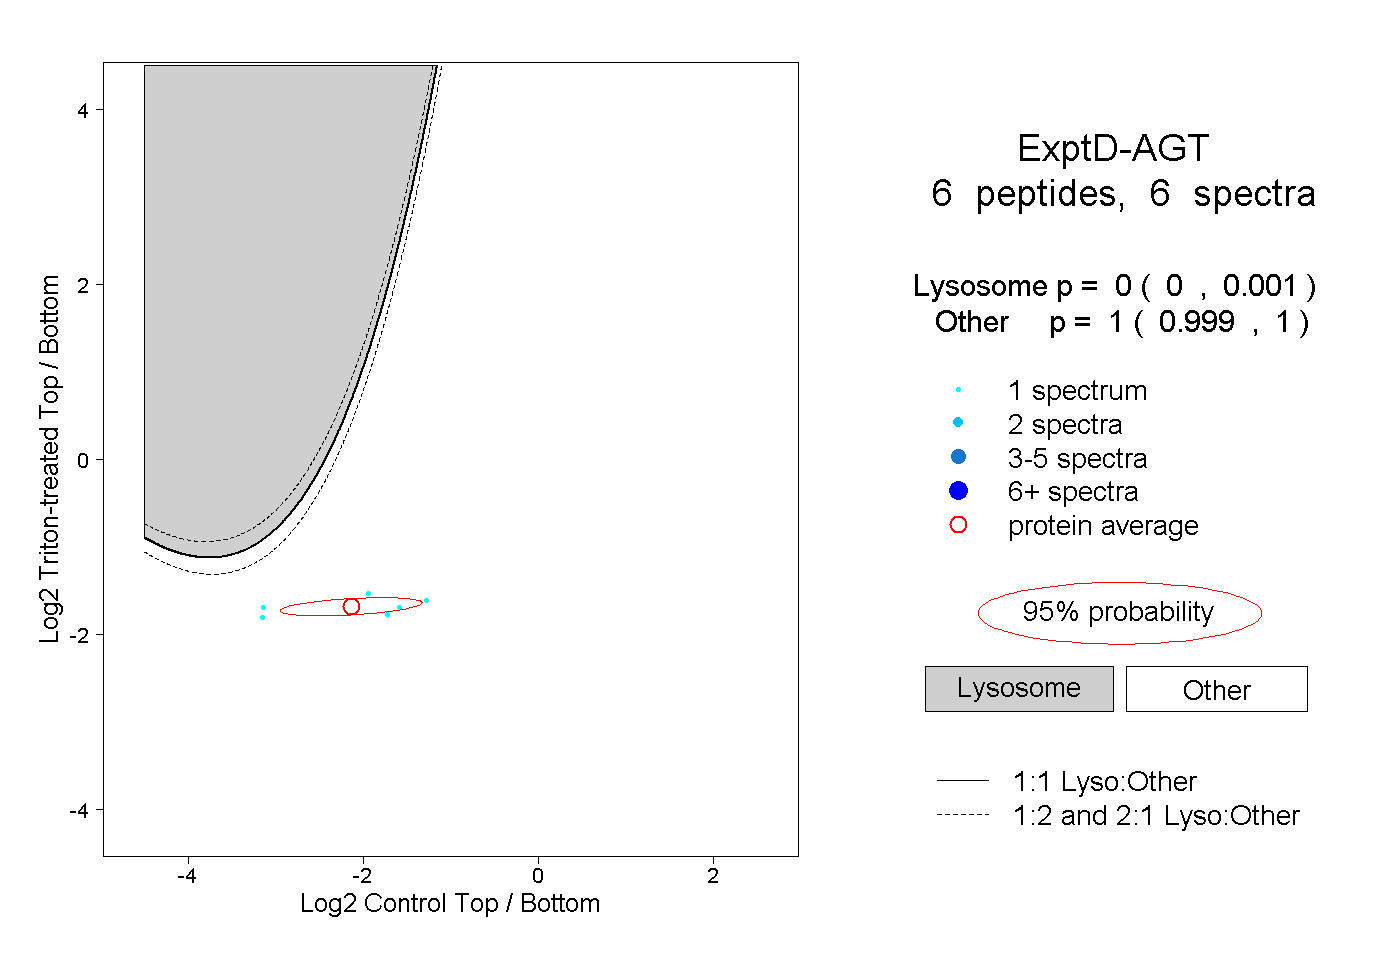 |
0.000 0.000 | 0.001 |
1.000 0.999 | 1.000 |