 8
8peptides
spectra
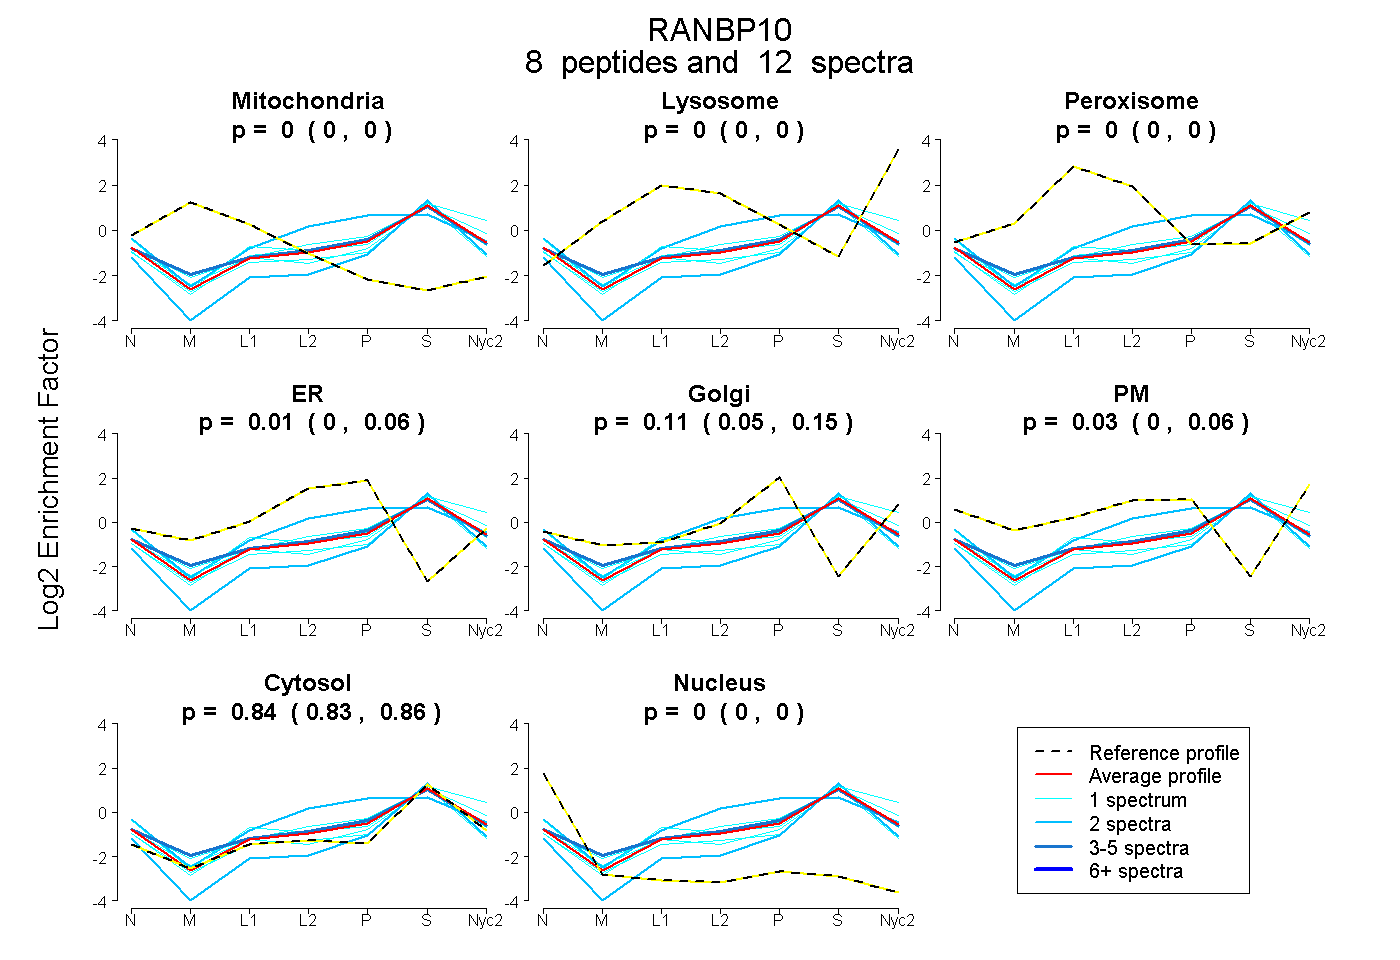
0.000 | 0.000
0.000 | 0.000
0.000 | 0.000
0.000 | 0.058
0.050 | 0.153
0.000 | 0.061
0.829 | 0.858
0.000 | 0.000
| Plot | Mito | Lyso | Perox | ER | Golgi | PM | Cytosol | Nucleus | |||||
| Expt A |
8 peptides |
12 spectra |
|
0.000 0.000 | 0.000 |
0.000 0.000 | 0.000 |
0.000 0.000 | 0.000 |
0.012 0.000 | 0.058 |
0.115 0.050 | 0.153 |
0.028 0.000 | 0.061 |
0.845 0.829 | 0.858 |
0.000 0.000 | 0.000 |
| 3 spectra, VQGTVHGFPISAR | 0.000 | 0.000 | 0.034 | 0.024 | 0.124 | 0.030 | 0.787 | 0.000 | ||
| 1 spectrum, VGEAIETTQR | 0.000 | 0.000 | 0.023 | 0.079 | 0.000 | 0.088 | 0.806 | 0.004 | ||
| 1 spectrum, LVLEGR | 0.000 | 0.100 | 0.000 | 0.000 | 0.038 | 0.037 | 0.825 | 0.000 | ||
| 1 spectrum, AGLGSCSFAR | 0.025 | 0.000 | 0.008 | 0.020 | 0.051 | 0.000 | 0.854 | 0.042 | ||
| 1 spectrum, EPVCAALNSAILESQNLPK | 0.000 | 0.000 | 0.000 | 0.000 | 0.055 | 0.003 | 0.936 | 0.006 | ||
| 1 spectrum, ELQALSEQLGR | 0.000 | 0.001 | 0.000 | 0.000 | 0.080 | 0.137 | 0.782 | 0.000 | ||
| 2 spectra, IILFGR | 0.000 | 0.000 | 0.000 | 0.000 | 0.000 | 0.000 | 0.919 | 0.081 | ||
| 2 spectra, MTETPIQEEQASIK | 0.000 | 0.000 | 0.000 | 0.378 | 0.000 | 0.000 | 0.622 | 0.000 |
| Plot | Mito | Lyso or Perox | ER | Golgi | PM | Cytosol | Nucleus | ||||||
| Expt B |
1 peptide |
3 spectra |
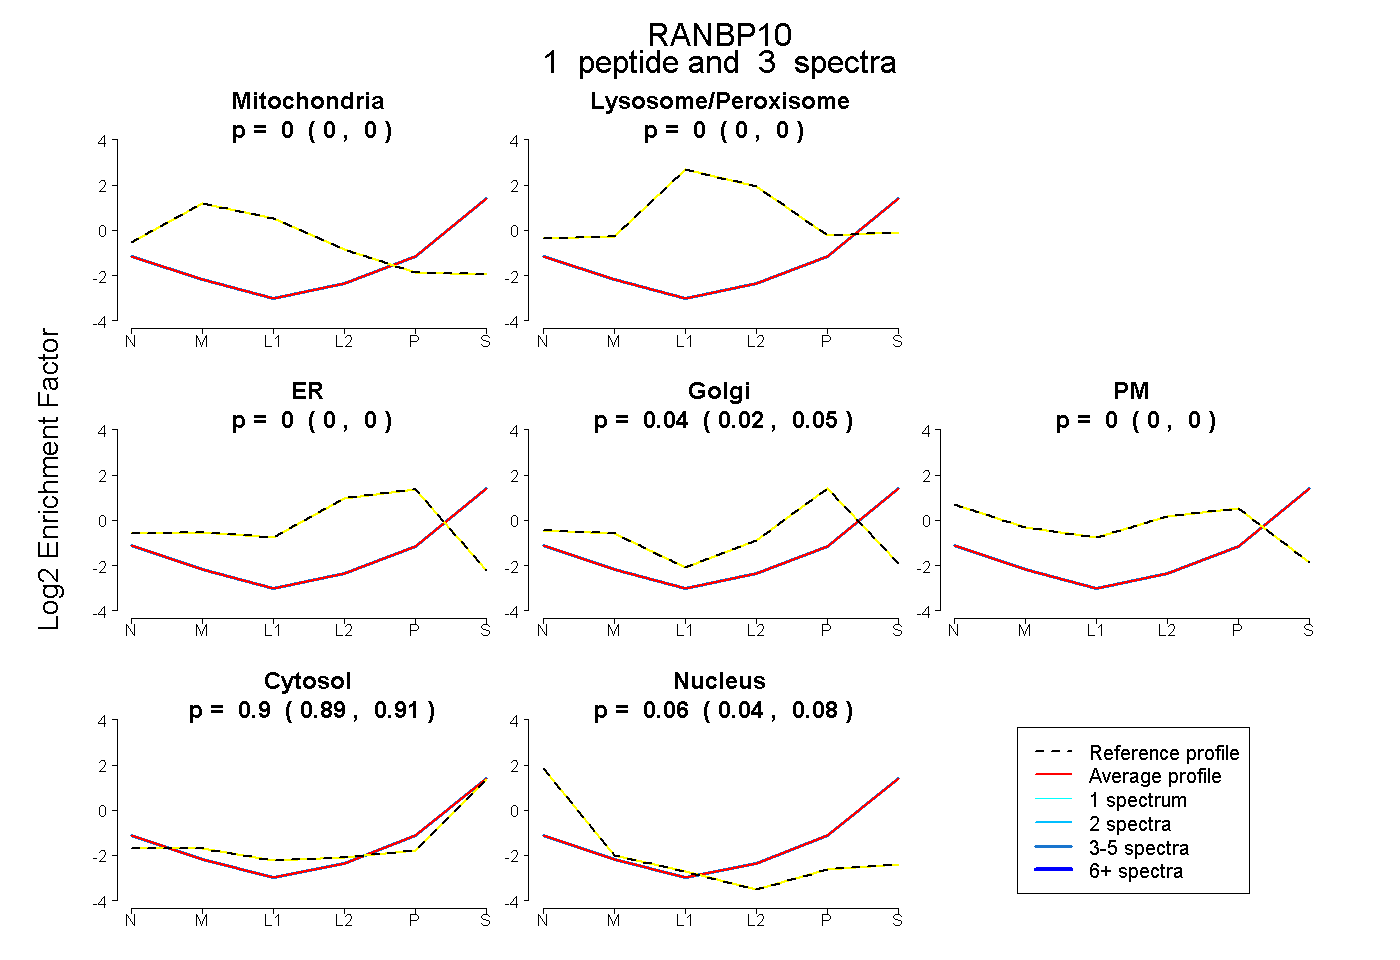 |
0.000 0.000 | 0.000 |
0.000 0.000 | 0.000 |
0.000 0.000 | 0.000 |
0.037 0.016 | 0.053 |
0.000 0.000 | 0.000 |
0.902 0.888 | 0.913 |
0.062 0.037 | 0.082 |
|||
| Plot | Lyso | Other | |||||||||||
| Expt C |
2 peptides |
4 spectra |
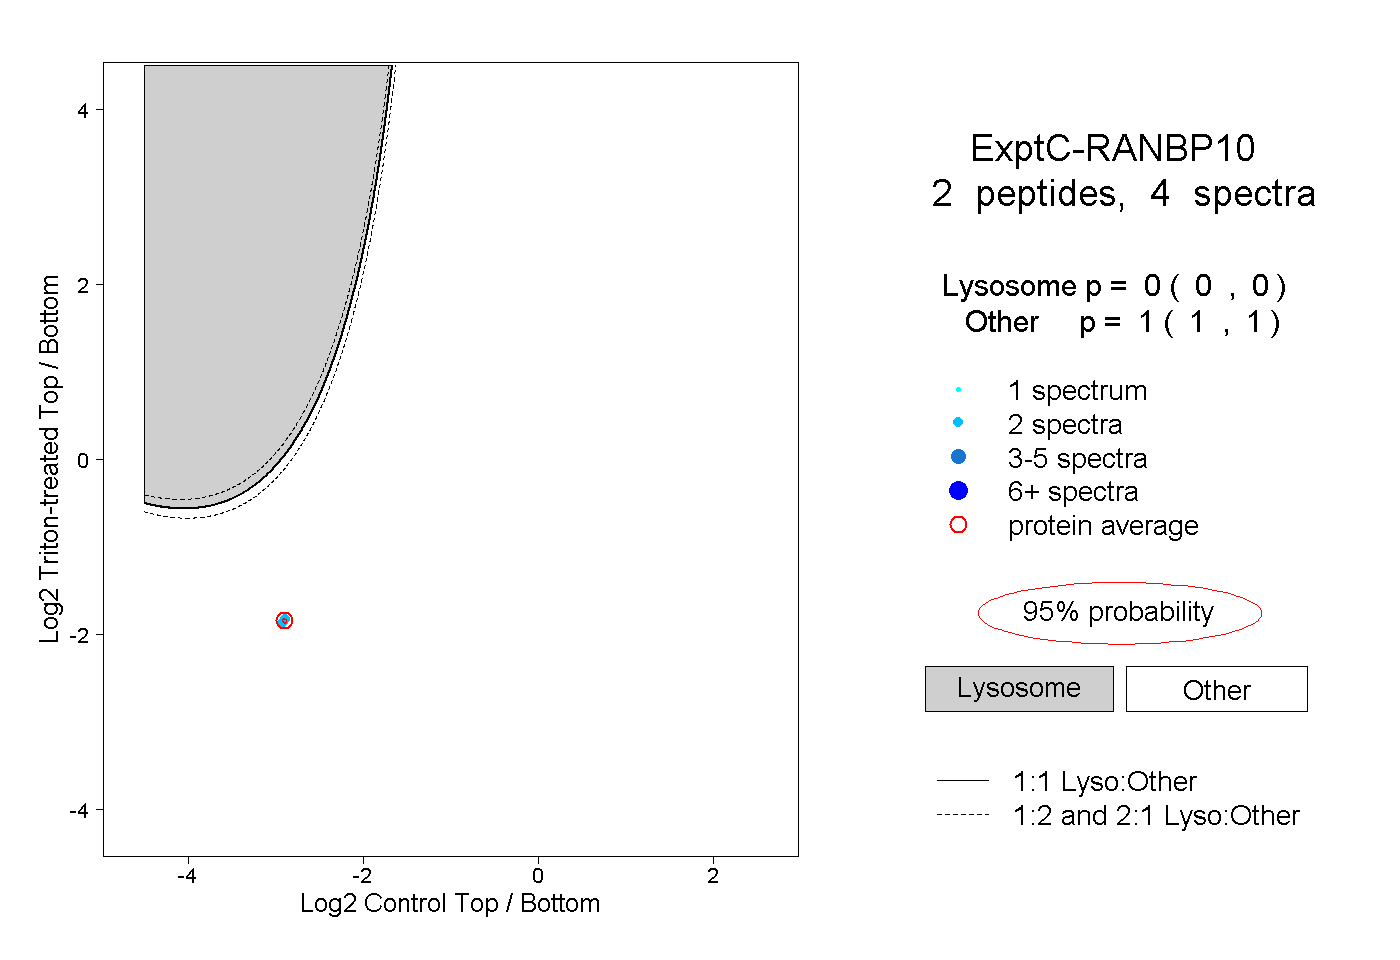 |
0.000 0.000 | 0.000 |
1.000 1.000 | 1.000 |